Solana price risks breakdown as double top pattern forms and TVL drops
Solana price is close to confirming a bearish breakout of a double top pattern that signals its downtrend could extend over the coming weeks.
- Solana price is down over 12% this month.
- Declining network activity and ETF inflows have reduced investor appeal for the token.
- A mult-year double top pattern has formed on the weekly chart.
According to data from crypto.news, Solana (SOL) was trading at $127.7, down 12.3% from its monthly high and over 48% below its highest point in September.
The seventh-largest crypto asset could be at risk of further decline as it has formed a giant bearish pattern on the charts, as some of the network’s key on-chain metrics have slumped over the past few months.
Data from CoinGlass shows that the total value locked across DeFi protocols built on the blockchain has dropped to $23.8 billion, down from its yearly high of $35.1 billion seen in September. The fees generated by protocols running on Solana also fell from $31 million to $8 million within the same period.
Together, these metrics hint that user activity on the network has weakened, which in turn seems to have reduced investor demand for the token.
Demand for Solana has also been hit by a slowdown in spot Solana ETF inflows. Data compiled by SoSoValue shows that the eight SOL ETFs recorded $199.2 million during the first trading week after launch but have since declined, with only $13.1 million recorded last week. Such a drop in inflows suggests weakening demand among institutional investors, which could subsequently affect retail interest as well.
Solana price analysis
On the weekly chart, Solana has been shaping up a massive double top pattern since mid-2024. Such a formation is characterized by two rounded tops with a trough in between and is often seen as a bearish reversal signal when confirmed by a break below the neckline.
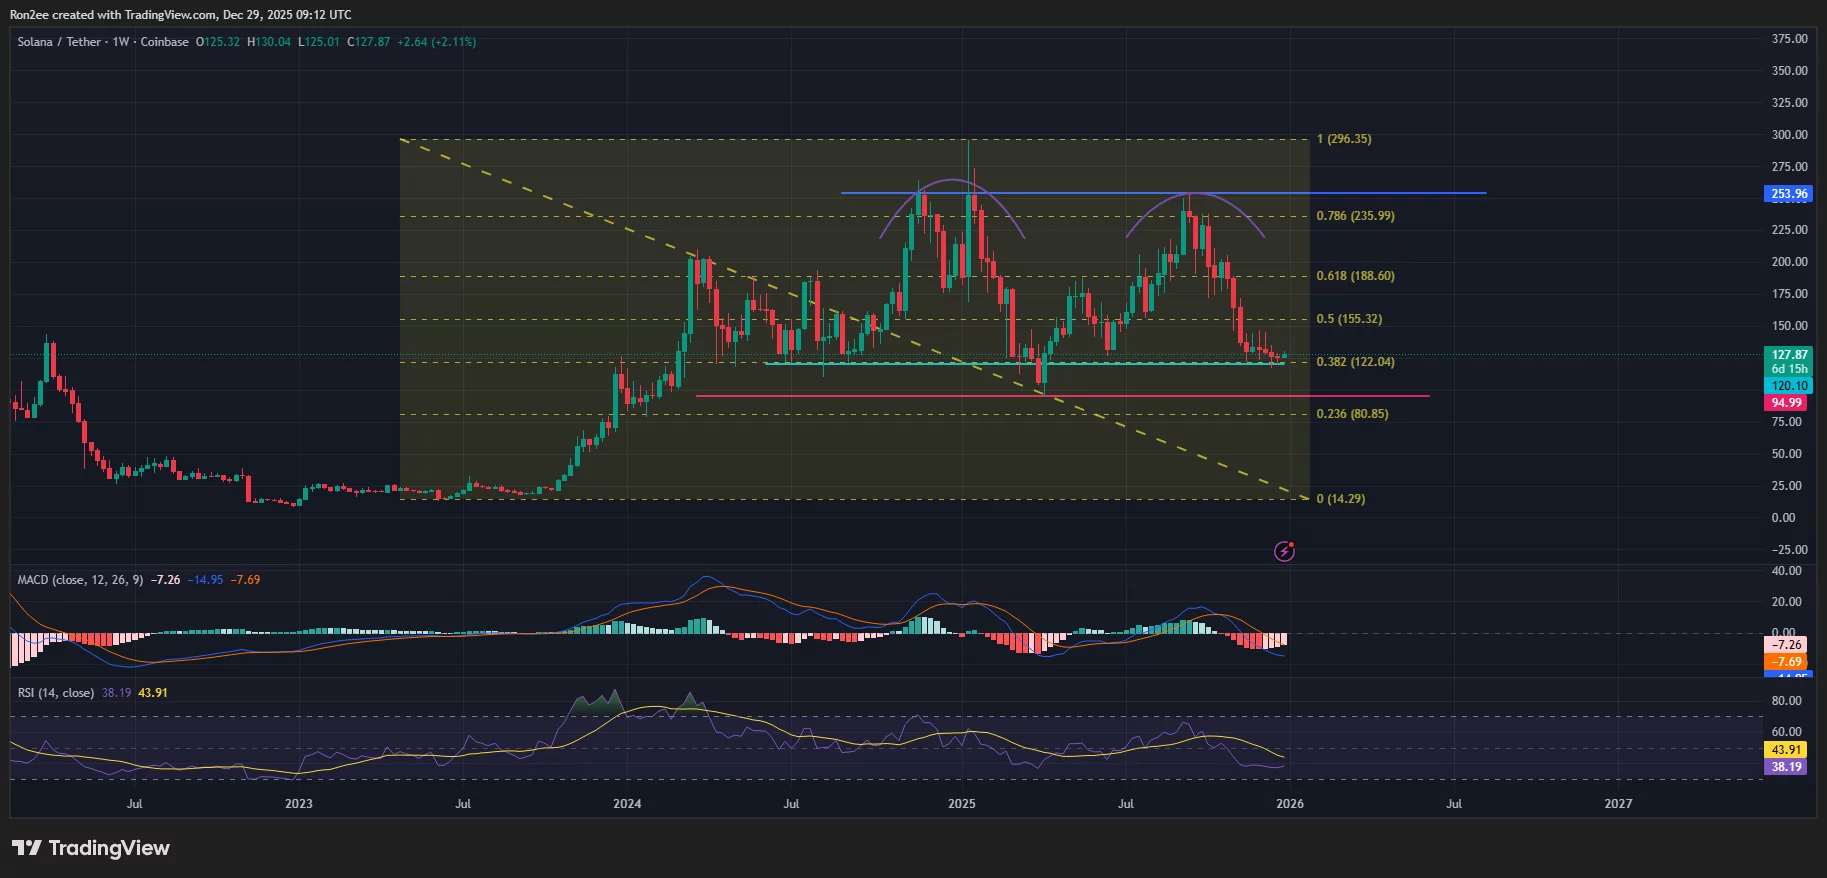
At the time of writing, Solana price looked likely to break below the neckline of the pattern at $120. In technical analysis, such a pattern is confirmed when an asset’s price breaks below the neckline and typically leads to more downside, especially when momentum indicators are also signaling weakness.
Momentum indicators like the MACD and RSI were trending downwards at press time, showing that bears were dominant in the market.
Hence, Solana price risks a drop to its April 7 low of $95 next if it fails to hold $120 as support. The level has served as a crucial floor for the greater part of this year.
On the contrary, a sharp rebound above $155, which aligns with the 50% Fibonacci retracement level, could invalidate the bearish setup and trigger a potential recovery.


추천 콘텐츠

Is Trump Manipulating the Crypto Market?

Robotics Automation Prototyping: Engineering Kinetic Agility into End-Effectors