BTC Price Analysis: Why the Next Move Above $90K Could Be Massive
Bitcoin is currently trading in a compressed environment following a sharp corrective move, with recent price action suggesting stabilization rather than trend continuation.
Both technical structure and on-chain behavior point toward a phase of digestion as the market assesses whether current levels will attract sustained demand.
Bitcoin Price Analysis: The Daily Chart
On the daily timeframe, BTC remains below the major resistance zone around the $95K area, which continues to cap upside attempts.
The cryptocurrency is trading within a broader corrective structure after failing to sustain above the prior high-value area. The recent candles show reduced volatility and overlapping ranges, signaling indecision rather than aggressive selling.
Importantly, downside momentum has slowed as price approaches the upper end of the multi-month descending channel at $90K and is poised to break above it.
Despite this stabilization, the daily structure has not yet shifted bullish. BTC is still trading below key dynamic resistance levels and has not convincingly reclaimed the $90K resistance. As long as the price remains below the $95K region, the daily bias favors consolidation within the current range rather than a trend reversal.
A sustained move above resistance would be required to confirm renewed upside momentum, while a failure to hold current levels could reopen the path toward deeper demand.
 Source: TradingView
The 4-Hour Chart
The 4-hour chart highlights the most recent developments more clearly.
Bitcoin is consolidating tightly within a short-term range after a prolonged selloff, forming a base between rising local support and overhead resistance.
The most recent price action shows multiple attempts to push higher, but these have lacked follow-through, indicating that supply remains active on rallies.
At the same time, downside attempts are being absorbed near the lower boundary of the range, suggesting that sellers are losing momentum.
This balance between buyers and sellers reflects a classic compression phase, where liquidity is building on both sides.
Until a clear breakout above the $95K range occurs, the market is likely to remain range-bound, with short-term moves driven by liquidity grabs rather than directional conviction.
For the short-term, a clean break above the short-term resistance at $90K would improve the intraday outlook, while a rejection would likely accelerate a move toward the $82K region.
 Source: TradingView
Sentiment Analysis
The spot average order size data provides important insight into participant behavior during this consolidation phase. Recent activity shows a noticeable presence of green dots, representing whale-sized spot orders, clustering around the current price range. This shift contrasts with earlier phases of the correction, where retail-sized orders were more dominant and larger players were largely absent.
The re-emergence of whale activity during consolidation suggests that larger participants are becoming more involved at these levels, potentially signaling early accumulation rather than distribution.
Unlike retail-driven rallies, spot whale participation typically reflects longer-term positioning, especially when it appears during low-volatility, range-bound conditions. This behavior implies that downside risk may be gradually decreasing as stronger hands absorb supply.
While this does not guarantee an immediate bullish reversal, the on-chain structure supports the idea that Bitcoin is transitioning from aggressive selling into a stabilization phase. If whale participation continues to increase while price holds above key demand zones, the probability of a more constructive price structure emerging in the coming sessions would rise.
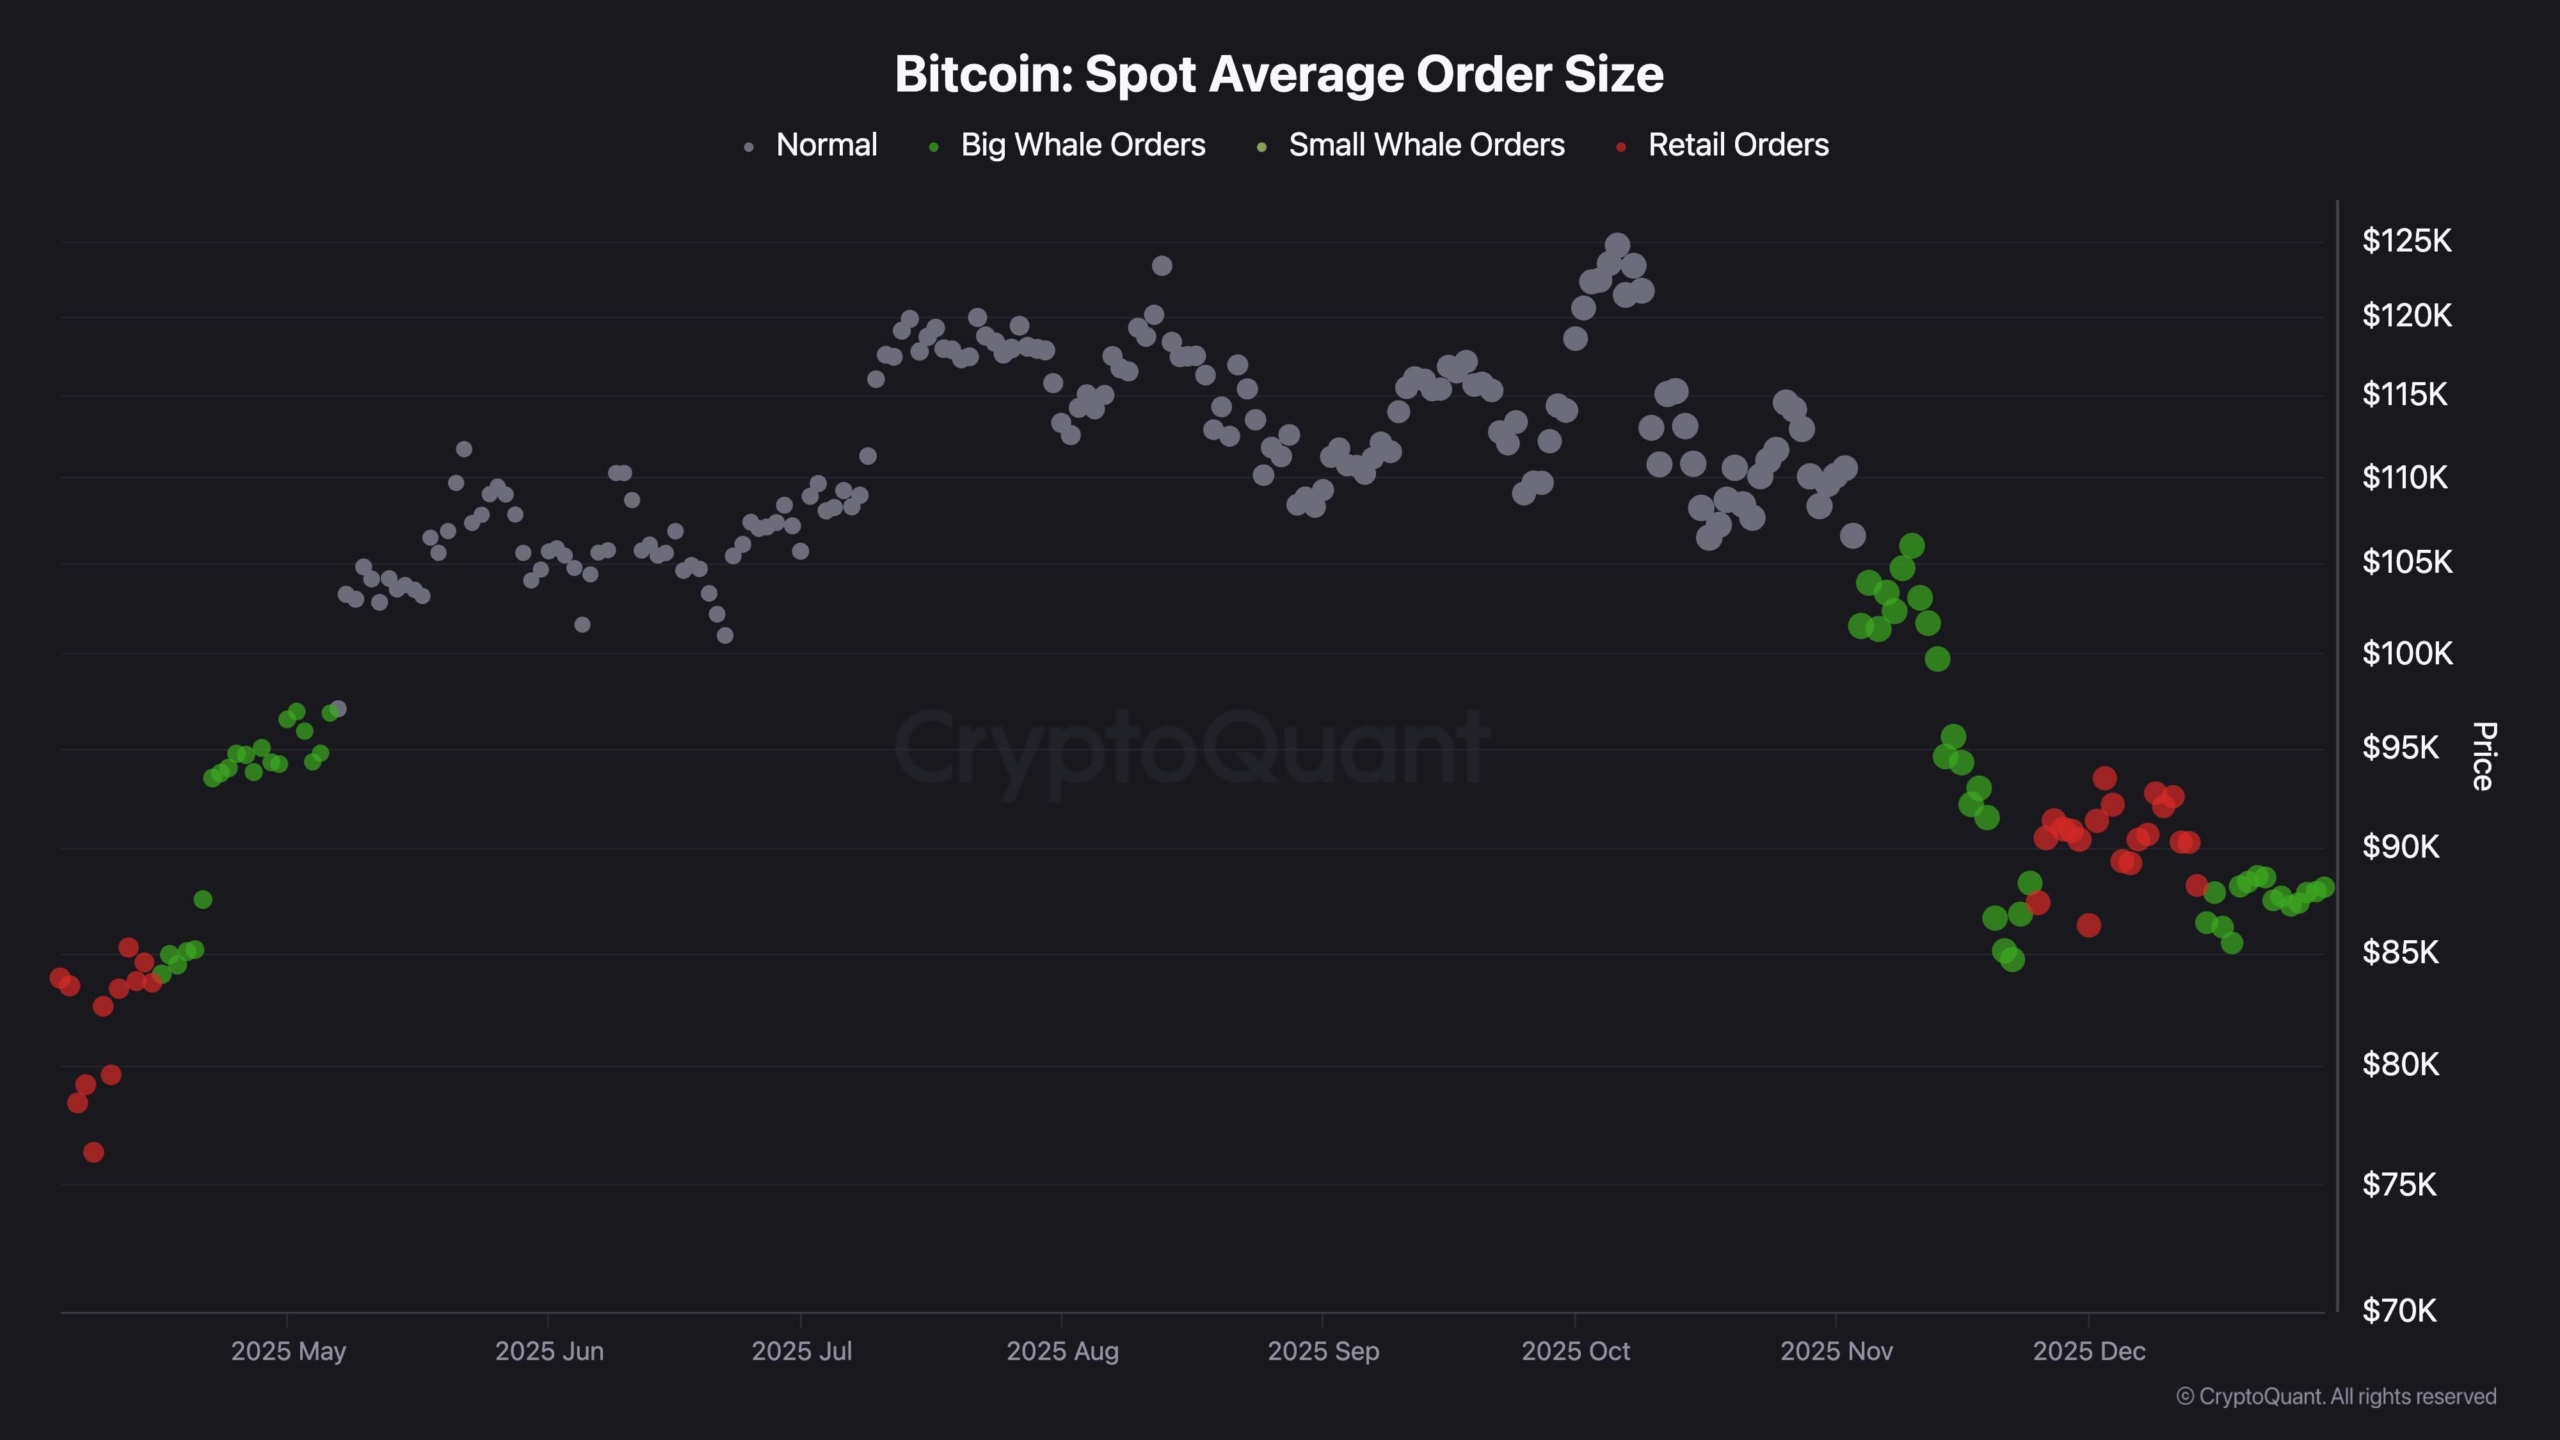 Source: CryptoQuant
The post BTC Price Analysis: Why the Next Move Above $90K Could Be Massive appeared first on CryptoPotato.


추천 콘텐츠

Globalstar (GSAT) Stock Surges 15% on Amazon Acquisition Report

Metaplanet Stock Passes MARA to Become Third-Largest BTC Holder — Stock Slips Anyway