

The Real Reason Bitcoin Is Stuck: Futures Trading Dwarfs ETFs 20-To-1
Bitcoin’s recent inability to escape a tight trading range may have less to do with spot Bitcoin ETF flows than many headlines suggest, and more to do with the derivatives complex still doing most of the heavy lifting, even as futures activity cools.
That’s the core argument from CryptoQuant analyst Darkfost (@Darkfost_Coc), who said Bitcoin futures volumes have been “cut in half since November 22,” dropping from $123 billion in daily volume to $63 billion.
Futures, Not ETFs, Are Holding Bitcoin In Place
The slowdown, he added, “partly explains the low volatility observed on BTC in recent weeks.” But the bigger point is relative scale: at $63 billion per day, futures still represent “nearly 20 times the volume of spot Bitcoin ETFs ($3.4B) and about 10 times spot market volumes ($6B),” according to the analyst.
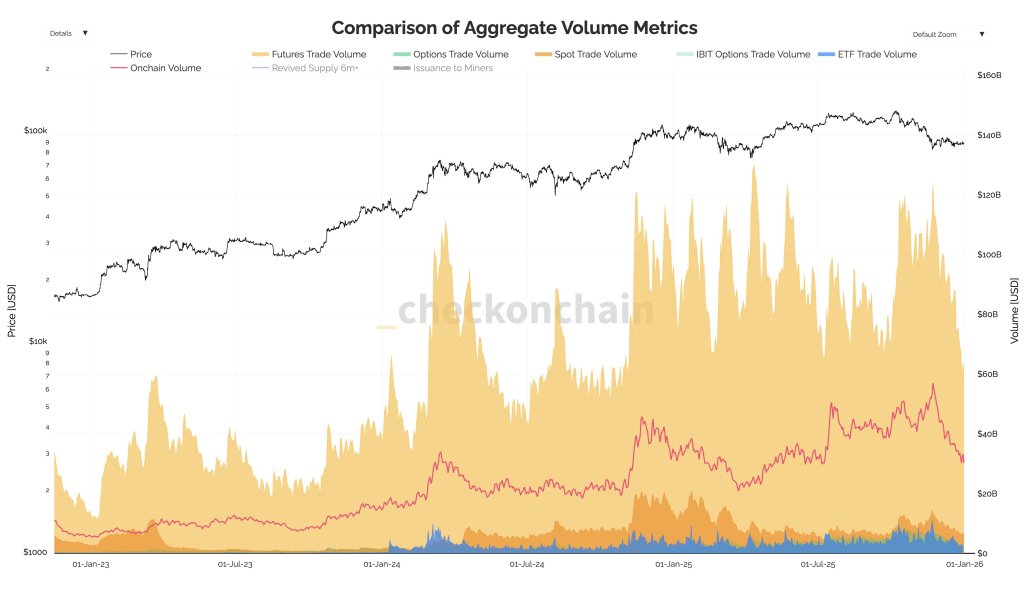
In other words, even if ETF outflows are real and visible, they may not be the dominant marginal force setting the tone. “Many continue to point to ETFs, which have experienced significant outflows in recent weeks,” Darkfost wrote. “While these outflows do contribute to selling pressure, futures markets clearly remain the dominant force in overall volumes.”
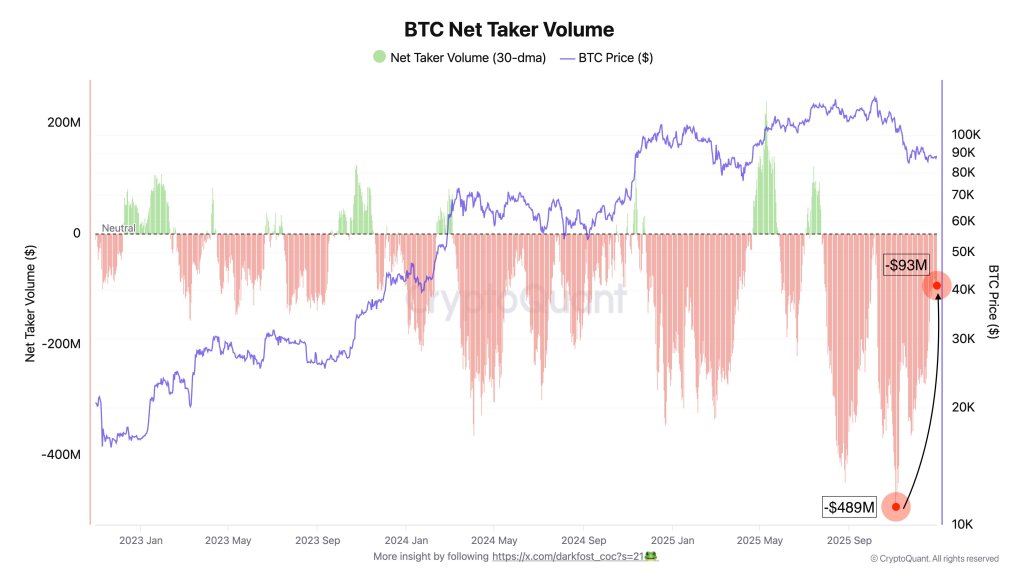
Darkfost pointed to net taker volume, a derivatives metric used to infer whether aggressive buying or selling is dominating, as a cleaner read on why price has struggled to trend. He framed it in conditional terms based on prior market behavior: “Each time net taker volume has turned negative, Bitcoin has entered a corrective phase. When this indicator moves into negative territory, selling volume dominates.”
In his telling, the market has been living with that bias for months. Since July, net taker volume has “generally remained negative,” he said, with one notable interruption: “A noticeable slowdown occurred in early October, allowing Bitcoin to set a new all time high, but selling pressure quickly regained control. Today, selling volumes continue to dominate and have kept Bitcoin trapped in a range for about a month.”
There is, however, a tentative improvement in the same dataset. Darkfost said futures-driven selling pressure has declined since early November, with net taker volume improving from around -$489 million to -$93 million. He described that as “a positive signal,” but not yet enough to change the regime. “Liquidity remains weak,” he wrote, adding that ETF and spot volumes are “still too limited to allow BTC to break out of its current consolidation phase.”
Demand Is Key
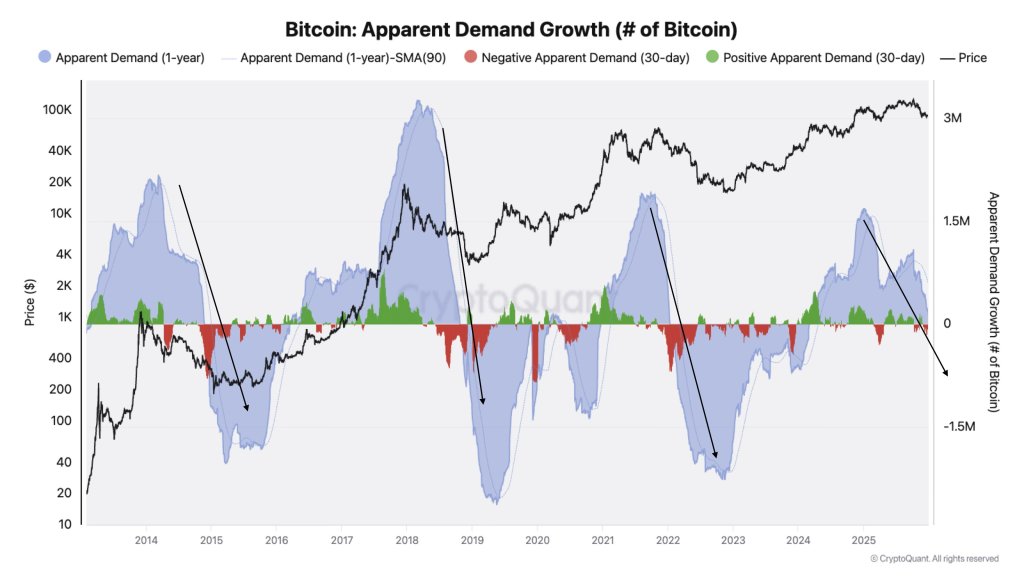
In a separate X post, CryptoQuant’s Head of Research Julio Moreno added a broader framing that shifts attention away from chart-based cycle narratives and toward demand dynamics. “Most are focusing on price performance to define a cycle, when it is demand what they should be looking to,” Moreno wrote. “Bitcoin demand is contracting on monthly terms and slowing down significantly on an annual basis (and about to get into negative territory).”
Alongside the futures-driven explanation for Bitcoin’s stall, the selling pressure from long-term holders (LTHs) emerged in recent weeks as the main driver for Bitcoin lagging performance against the stock market and gold. As reported yesterday, the long-term holder selling appeared to have stopped, according to multiple on-chain commentators, with around 10,700 BTC transitioning into long term held coins.
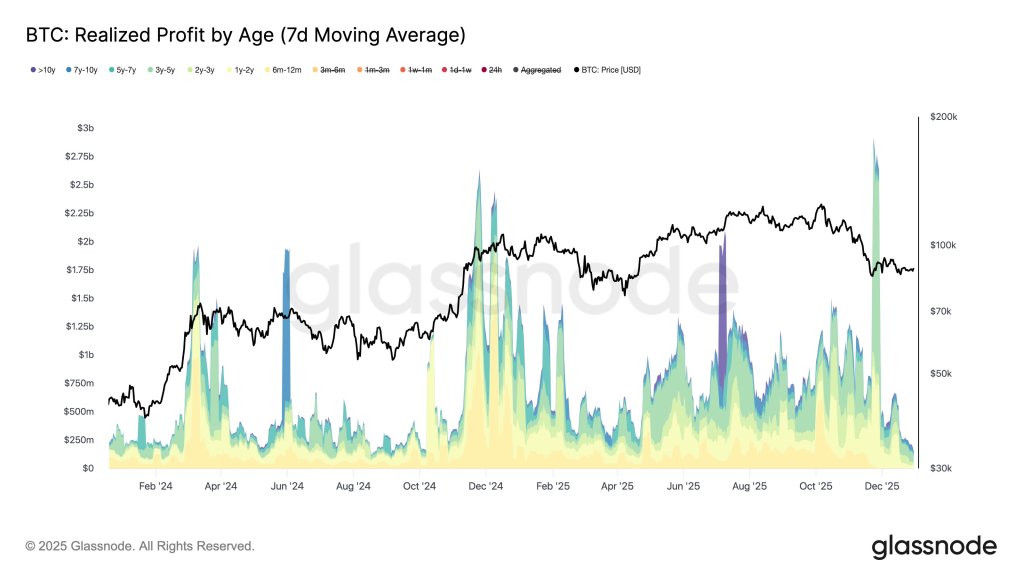
In his latest post, leading Glassnode analyst CryptoVizArt argued the change is more about tempo than direction. “LTHs didn’t stop selling,” the analyst wrote, claiming LTHs “are still spending ~7.3k BTC/day (7D SMA) and still realizing <$200M/day in profit. What changed is the rate, not the behavior. This is a cooldown after months of heavy distribution, not a flip to pure accumulation.”
Darkfost didn’t dispute that LTHs can be persistent sellers, but he emphasized a different lens. “LTHs never really stop selling in reality, but when we look at supply change, it gives a different picture,” he wrote. “It appears that their distribution has come to an end for now, meaning the amount of BTC maturing and transitioning into LTH status equals the BTC being sold by LTHs (STH buying).”
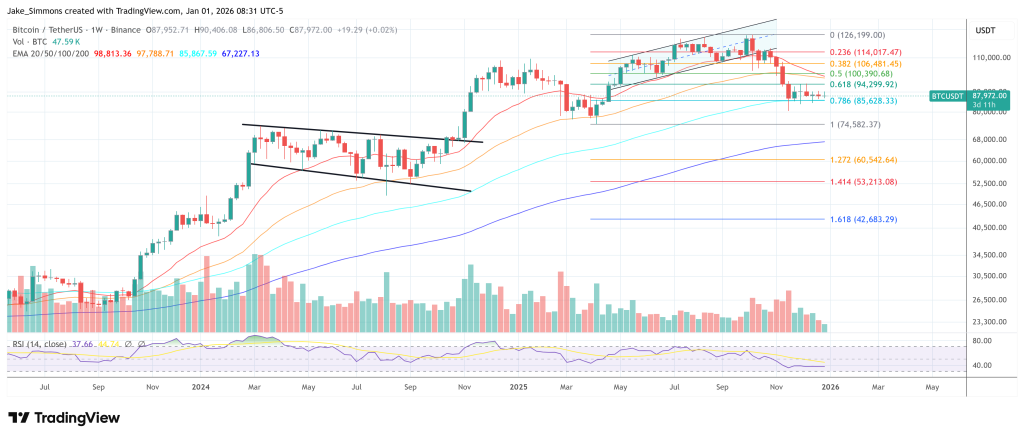
At press time, BTC traded at $87,972.


추천 콘텐츠

Will Bitcoin (BTC) Lose $70,000? Nothing Stops Shiba Inu (SHIB) From Recovering, XRP: Something Is Happening in Background: Crypto Market Review

How Bitcoin Mining Becomes the Hardest Defense System for Your Wealth


