HBAR price prints double bottom at $0.10, signaling momentum shift
HBAR price has formed a double bottom near $0.10–$0.11, signaling weak selling pressure and opening the door to a momentum and market structure shift.
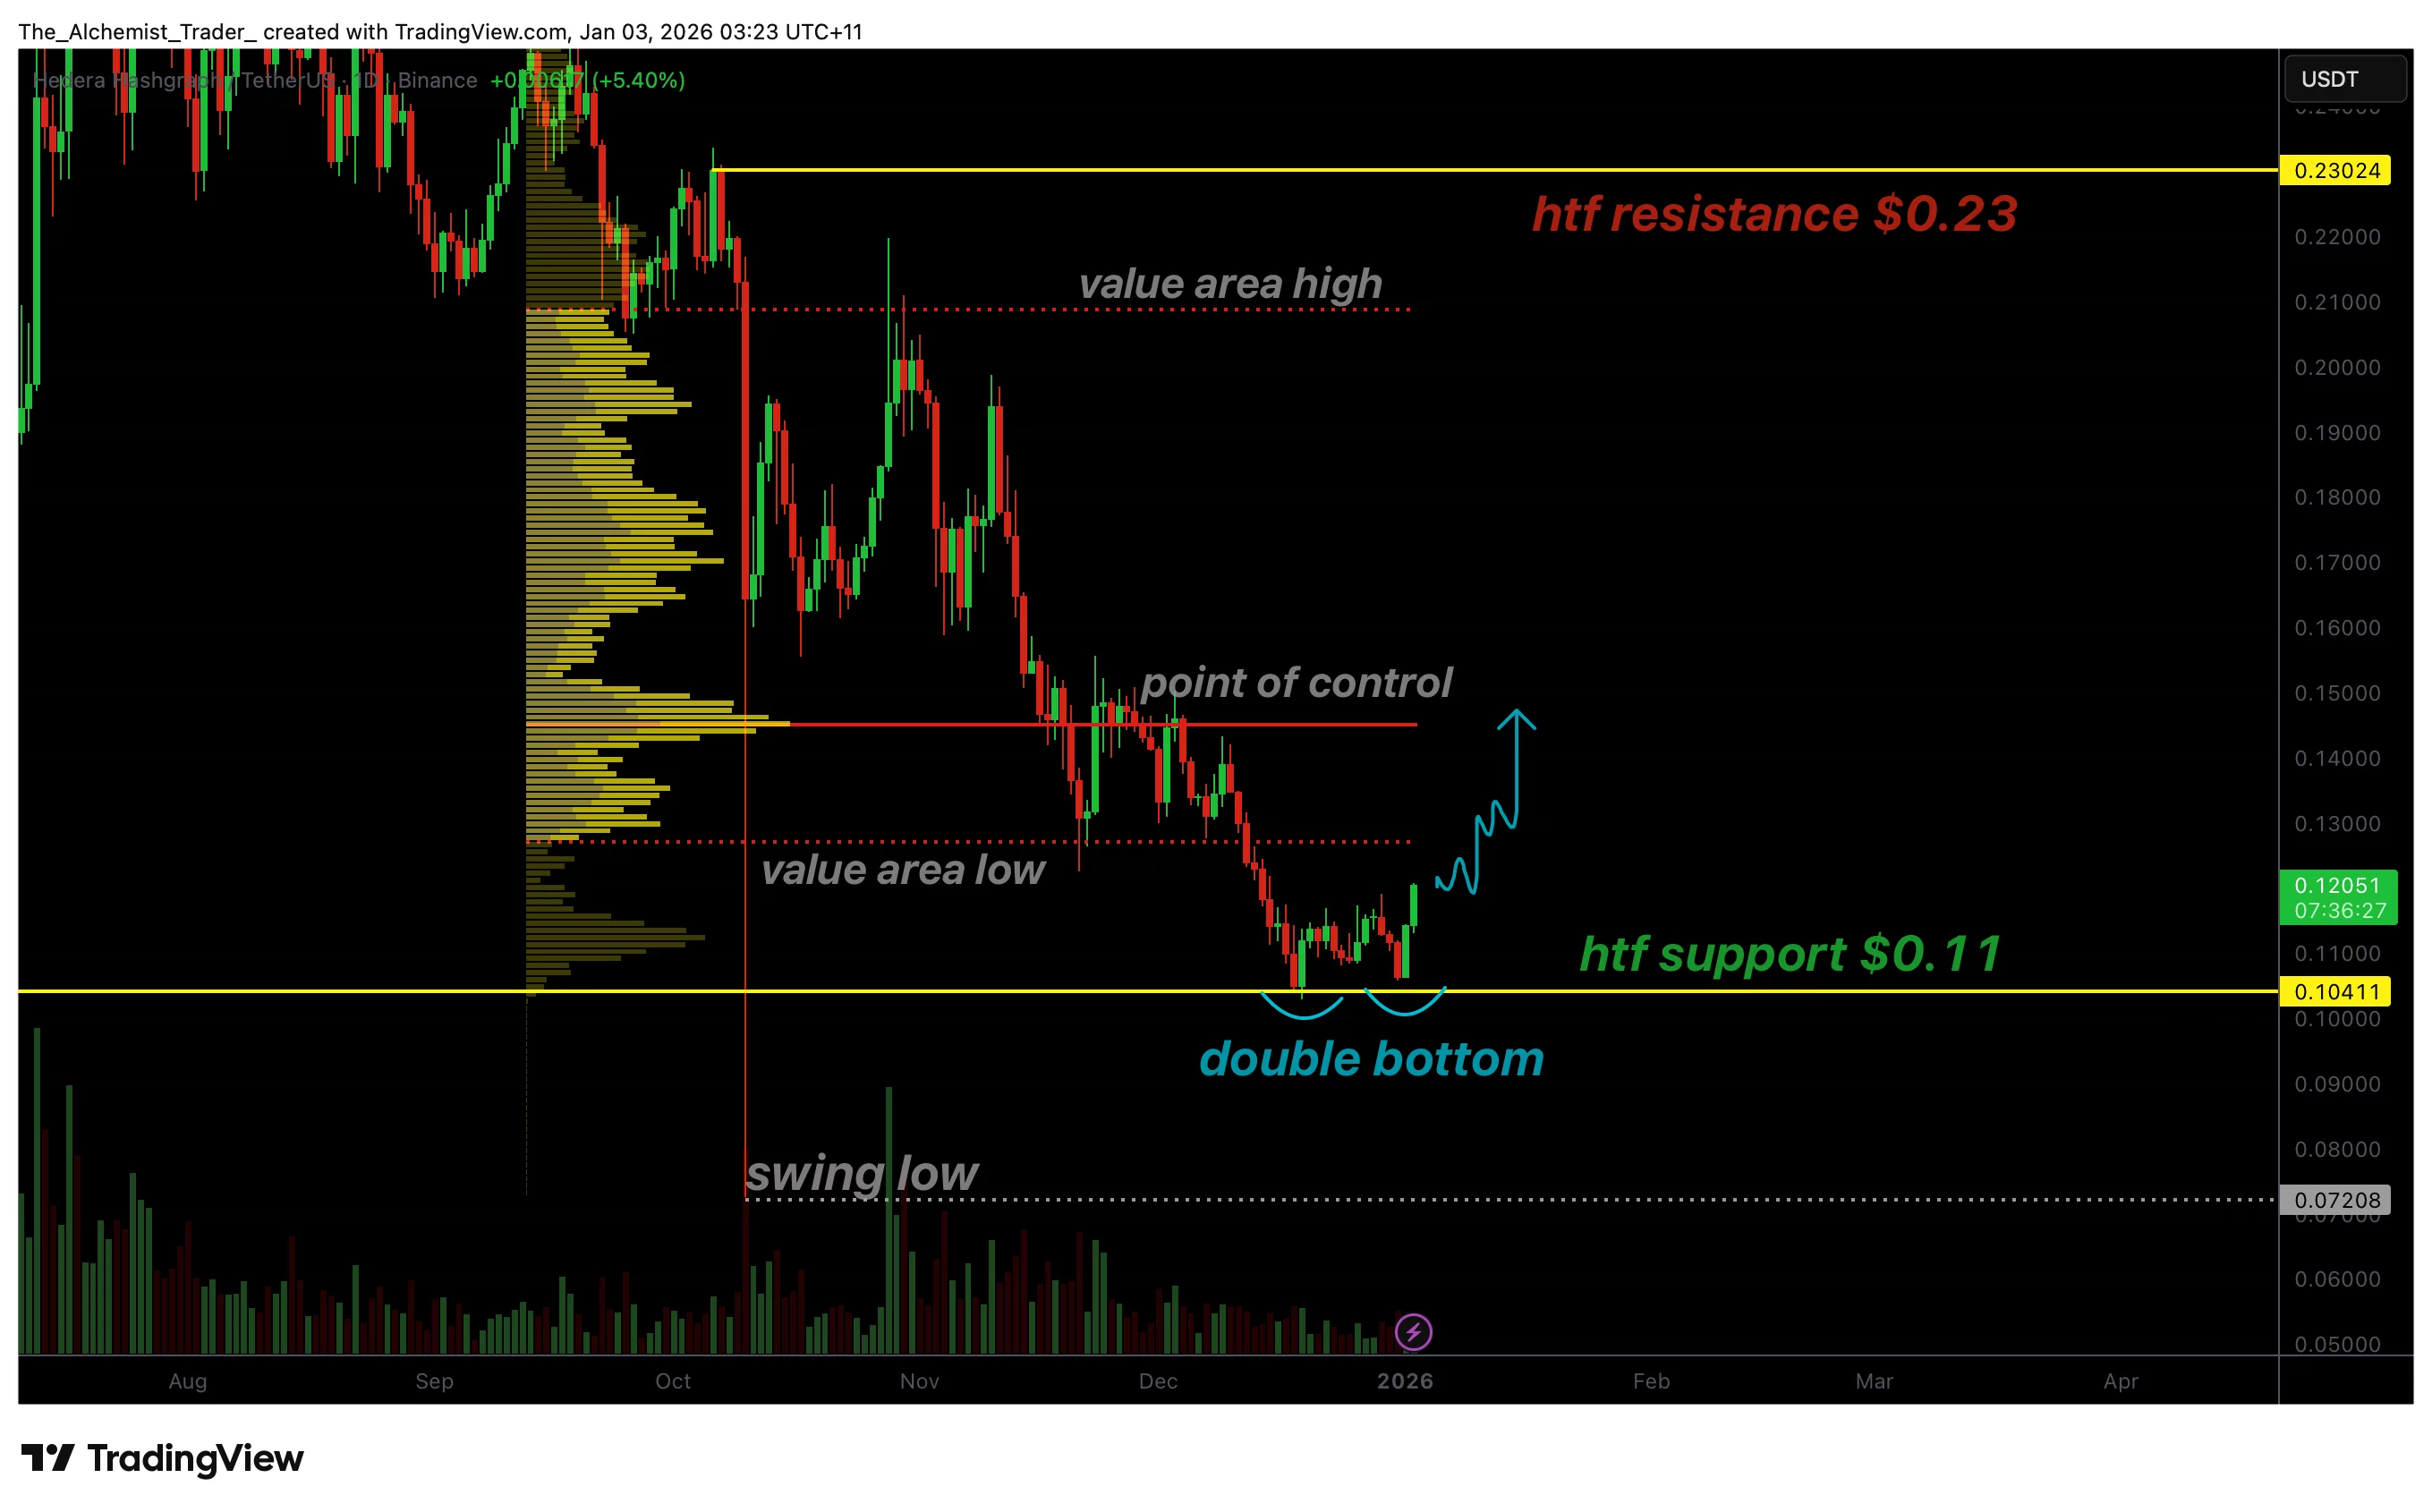
- A double bottom at $0.10–$0.11 confirms strong demand and reduced selling pressure.
- The value area low is the key level needed to confirm bullish continuation.
- A structure shift could open a rotation toward $0.23 high-time-frame resistance.
HBAR (HBAR) price is showing early technical signs of a potential trend reversal after printing a clear double bottom formation around the $0.10–$0.11 support zone. This pattern has emerged after an extended bearish phase and is often associated with seller exhaustion and growing buyer interest.
While the broader market structure remains bearish for now, recent price action suggests that downside momentum is fading. The key focus moving forward is whether HBAR can reclaim nearby volume levels to confirm that this developing base can evolve into a sustained rally.
HBAR price key technical points
- Double bottom confirms strong support: Price has defended the $0.10–$0.11 zone twice, indicating demand absorption.
- Value area low is the next hurdle: A reclaim would confirm bullish continuation and improving momentum.
- $0.23 remains the major upside target: A structure shift could trigger a full rotation toward high-time-frame resistance.
The double bottom pattern forming on HBAR is a significant technical development, particularly given its location at a well-defined support zone. After an initial sell-off, price tested the $0.10–$0.11 region and bounced, only to return to the same area and find support again. The inability of sellers to push price lower on the second test suggests that selling pressure is being absorbed.
Double bottoms are commonly viewed as reversal patterns, especially when they form after prolonged downside trends. They indicate that market participants are increasingly willing to buy at a specific level, creating a base from which the price can rotate higher. In HBAR’s case, this base has provided the foundation for the recent bounce toward higher volume levels.
Following the formation of the double bottom, HBAR has rallied into the value-area low, which represents the next major volume-based resistance level. This level often acts as a decision point, determining whether a move is merely a short-term relief bounce or the start of a larger trend change.
Acceptance and a daily close above the value area low would be technically significant. It would suggest that price is no longer trading at a discount and that buyers are gaining control within value. Historically, reclaiming this level often leads to continuation toward the point of control, where the highest concentration of recent trading volume has occurred.
Despite improving momentum, HBAR’s broader market structure remains bearish, characterized by a series of lower highs and lower lows. However, the double bottom introduces the conditions needed for a potential structural shift. If price continues higher and begins to establish higher lows, it would mark the first step toward reversing the prevailing trend.
A decisive reclaim of key volume levels would increase the probability of HBAR transitioning into a bullish structure. This would open the door to consecutive higher highs, confirming that the momentum shift is not merely corrective but structural.
If HBAR successfully confirms a structure shift, the next primary upside target comes into focus near $0.23, which represents high-time-frame resistance. This level has previously acted as a significant rejection zone and aligns with the upper boundary of the broader trading range.
A rotation toward $0.23 would represent a full-range expansion from the double-bottom base, consistent with how markets often respond after prolonged accumulation at support. The strength of the move into this resistance will be critical in determining whether HBAR can extend gains further or return to consolidation.
What to Expect in the Coming Price Action
As long as HBAR holds above the $0.10–$0.11 support zone, the technical outlook favors further upside. The immediate focus remains on reclaiming and holding above the value area low, which would confirm bullish momentum and increase the probability of a market structure shift.


추천 콘텐츠

XRP Eyes $17 After Massive Breakout—Is A 1,100% Surge Next?

Top Benefits of Lean Six Sigma Yellow Belt Training for Career Growth