

Bitcoin Price To Hit $100K in Coming Weeks – Here’s Why

The post Bitcoin Price To Hit $100K in Coming Weeks – Here’s Why appeared first on Coinpedia Fintech News
Bitcoin price is approaching a decisive moment that could shape its next major move, with bullish momentum steadily building as 2026 begins. After weeks of consolidation, BTC has reclaimed its 21-day moving average, a key technical signal that often marks a shift in short-term trend direction.
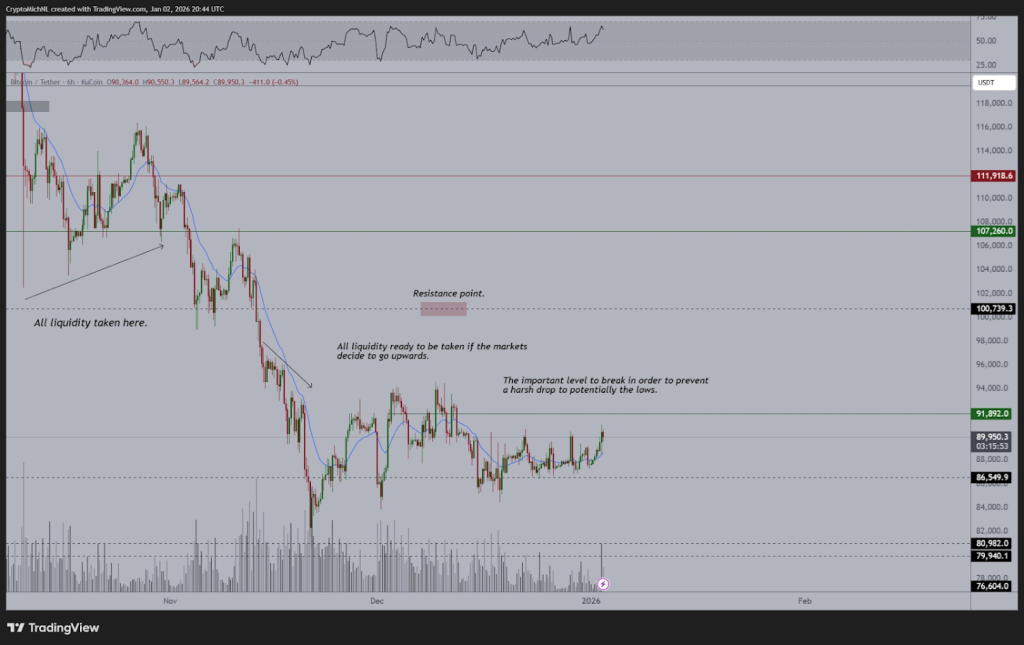
At the time of writing, Bitcoin is trading within a well-defined range between $84,000 and $90,000, a zone it has respected for over a month. The immediate focus for traders is the $90,000–$92,000 resistance band. A clean and sustained break above this level could quickly open the door toward $95,000, with $100,000 emerging as the next psychological and technical target.
Why Bitcoin Price is Poised For 30% Rally in the Coming Weeks?
Several historical and macro signals are aligning in Bitcoin’s favor as the market heads into Q1 2026.
1. Three Red Monthly Candles Pattern
Bitcoin recently printed three consecutive red monthly candles. Historically, the last four times this occurred, BTC formed a short-term bottom, followed by rebounds ranging from 30% to as high as 130%. This pattern has often marked exhaustion in selling pressure.
2. RSI Hits Oversold Levels
BTC’s Relative Strength Index (RSI) dipped into deeply oversold territory in recent weeks. In past cycles, similar RSI conditions have coincided with the end of major downtrends and the start of strong upside moves.
3. Nasdaq 100 Signals Risk-On Setup
The Nasdaq 100 began 2026 trading below its 50-day moving average. The previous four instances of this setup led to strong rallies during the first few months of the year, a trend that has historically benefited risk assets like Bitcoin.
4. Panic Signals in US Equity Markets
The US equity put/call ratio spiked toward the end of 2025, reflecting heightened investor fear and demand for downside protection. Historically, such spikes have marked local market bottoms, with positive returns often following over the next two to three months.
5. Potential Capital Rotation From Metals
Gold and silver added more than $13 trillion in combined market value during 2025. If metals enter a consolidation phase, profit-taking could drive some liquidity back into equities and crypto, supporting Bitcoin’s upside case.
- Also Read :
- Crypto Market Starts 2026 Strong: Bitcoin and Ethereum Above $90K and $3K; XRP Flips BNB
- ,
BTC Price, Key Levels to Watch
Bitcoin formed a local low near $80,500 on November 21. Since then, price action has remained constructive despite sideways movement. Reclaiming $90,000 on strong volume remains critical. A successful breakout could accelerate momentum toward $95,000, with a continuation likely targeting the $100,000+ region.
Overall, the bias remains bullish. As long as BTC holds above key short-term averages and buying pressure continues to build, the probability of a breakout increases. The coming week is expected to be crucial, as strong follow-through above resistance could confirm a fresh upward trend and bring 6-figure Bitcoin back into focus sooner than many expect.
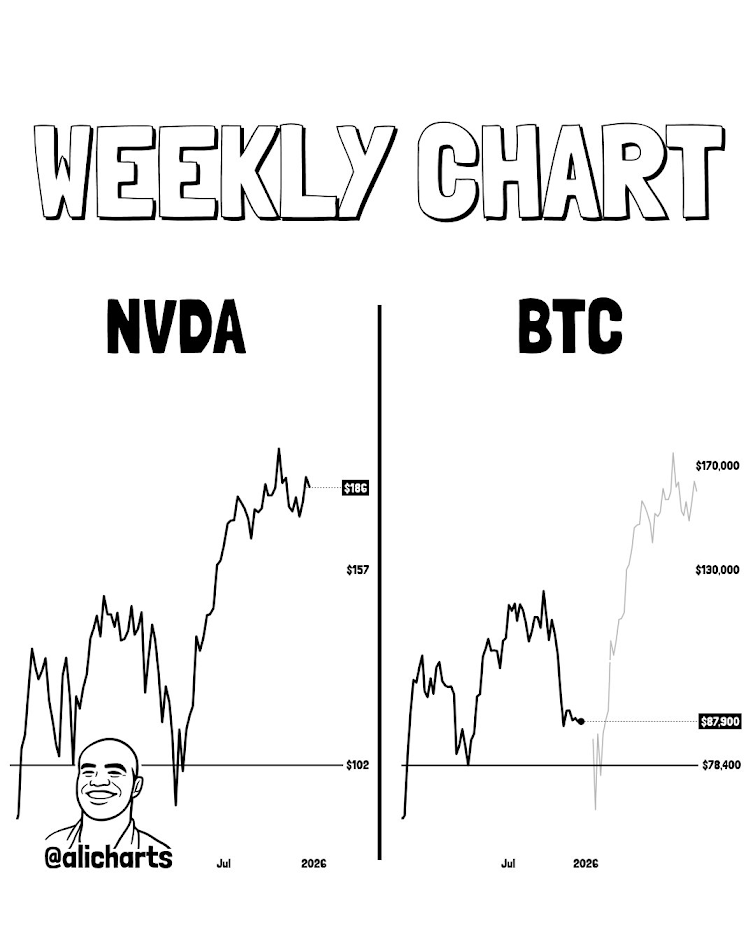
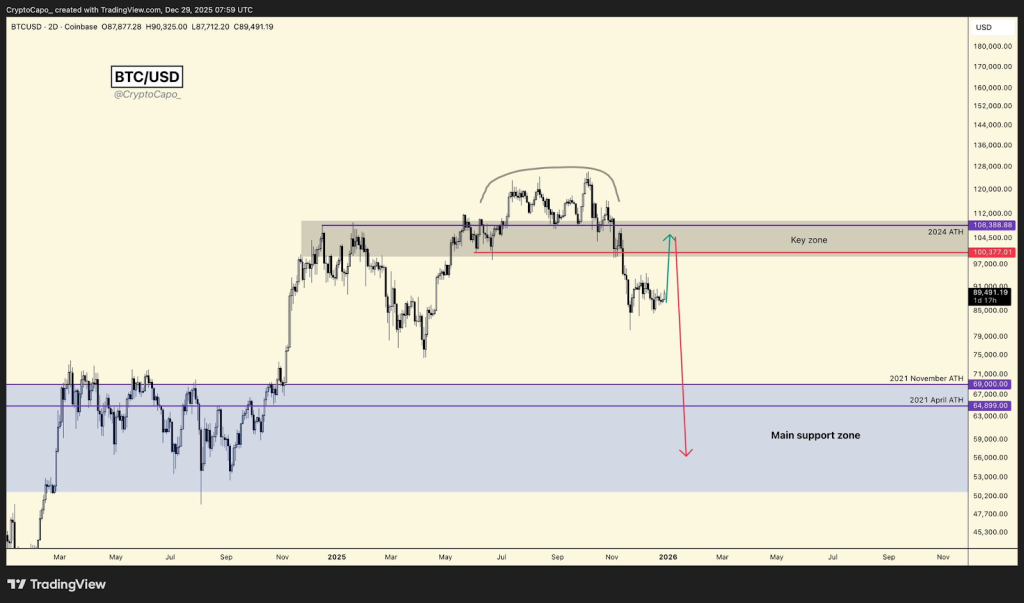
On the other hand, according to Ali charts, Recent market analysis suggests Bitcoin may be mirroring price behavior seen in NVIDIA ($NVDA) during previous market cycles. If this correlation plays out, BTC could briefly sweep liquidity below the $78,400 support level before staging a strong reversal.
FAQs
Bitcoin’s rally is fueled by technical rebounds, oversold RSI, equity market trends, and possible capital rotation from metals into crypto.
Sharp spikes in fear indexes, low liquidity zones, and sudden whale movements may hint at temporary dips before resuming upward momentum.
Rising rates may temporarily reduce crypto demand, while easing policies can boost inflows as investors seek higher-risk, higher-return assets.


추천 콘텐츠

China PBoC Interest Rate Decision in line with expectations (3%)

Veterans losing their homes in droves after Trump ignored major warning: report
![Can edgeX [EDGE] rebound after its 17% drop? THESE signals say…](https://i1.wp.com/ambcrypto.com/wp-content/uploads/2026/04/Abdul-2026-04-19T121716.811-e1776597537620.webp)


