

Altcoin Season Index Signals SOL and XRP Ready to Outpace Bitcoin
The Altcoin Season Index is approaching 40% as altcoin market capitalization reclaims $1.3 trillion, indicating that blue-chip altcoins like SOL and XRP may soon outperform Bitcoin, regardless of Bitcoin’s directional movement.
In a recent analysis shared by Joao Wedson, CEO of investment analytics platform Alphractal, he explained that the altcoin rally will materialize soon because many altcoins are already undergoing price stabilization, while BTC retains capacity for additional downside.
“We are seeing a setup similar to 2019 or 2022, when many altcoins failed to print new lows, while the Top 10 by market cap experienced much deeper drawdowns,” Wedson noted.
Wedson also revealed that whales are aggressively shorting Bitcoin despite the price breaking out of the $90,000 December range, while simultaneously going long on altcoins.
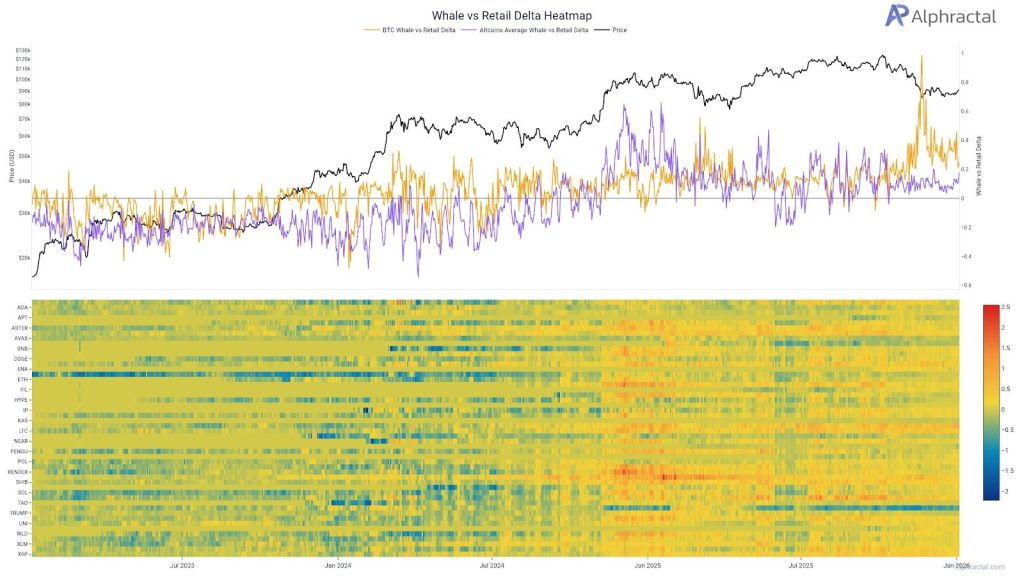 Source: Joao Wedson
“That’s why some altcoins are pumping while most people have no clue what’s really going on,” he explained.
XRP and SOL Lead Recent Altcoin Recovery
Over the last 7 days, Solana has surged over 8% to break out of its downtrend while XRP pumped nearly 14% to reclaim the $2.00 price level and surpass BNB as the 4th largest cryptocurrency by market capitalization.
Analysts observed that XRP is now stabilizing following a prolonged downtrend, displaying early signs of base formation.
From a structural standpoint, XRP has already completed two major historical impulse cycles.
The first cycle into 2014-2015 and the second into 2017-2018 both topped after roughly 49-50 monthly candles, each accompanied by clear volume expansion.
Price action since the 2018 peak has been compressed within a multi-year descending triangle/contracting range, defined by falling resistance from the 2018 high and a rising structural base.
 Source: TradingView
This compression phase appears to have resolved upward in 2024-2025, with XRP maintaining above the long-term mean and consolidating rather than collapsing after the breakout. That behavior typifies a wave (III) to wave (IV) transition, not a macro top.
On a log scale, the projected trajectory targets a wave V expansion into the $5-$10+ zone, which would align with prior cycle extensions once XRP exits long-term compression.
Provided XRP holds above its long-term structural support and doesn’t re-enter the pre-2024 range, the dominant bias remains upward, with the next major move likely explosive rather than gradual.
Solana Dominates Transaction Volume
According to Nansen AI, Solana dominated 2025 transactions with approximately 6× more than BNB Chain.
This is reflected in SOL digital asset investment products, which finished 2025 with $3.56 billion in inflows, more than a 1,000% increase from 2024, when Solana recorded $310 million in inflows.
Analysts have now observed that SOL is breaking out of the October downtrend, and attention should focus on the asset as $200+ becomes increasingly probable.
The daily SOL/USDT chart displays a clear shift from a strong bullish structure into a corrective and distributional phase. Earlier in the year, Solana respected multiple bullish breaks as the price advanced from the lower demand region near $100-$120 into the $240-$260 area.
However, failure to sustain price within the upper rejection block around $260-$290 marked a major inflection point, confirming strong sell-side pressure at elevated levels and initiating a broader downtrend.
Source: TradingView
Since that rejection, market structure has flipped bearish, with repeated bearish breaks and lower highs forming beneath successive supply zones around $200, $180, and $160.
The most important detail currently is that price is reacting to demand, but without a confirmed bullish break of the structure yet.
Provided SOL remains below the nearby supply zone around $145-$160, any bounce will likely be corrective rather than trend-reversing.
A clean break and acceptance above that supply area would represent the first signal that downside momentum is weakening and could unlock pathways for recovery toward $180 and $200.


추천 콘텐츠

UK FCA May Exempt Crypto Firms from Key TradFi Rules — What’s at Stake?

Bitcoin’s Resilience Piques Interest as It Targets New Milestones


