

Bitcoin Weekly Analysis: Momentum Builds Toward $98,000 Amid Neutral Mood
Bitcoin Magazine
Bitcoin Weekly Analysis: Momentum Builds Toward $98,000 Amid Neutral Mood
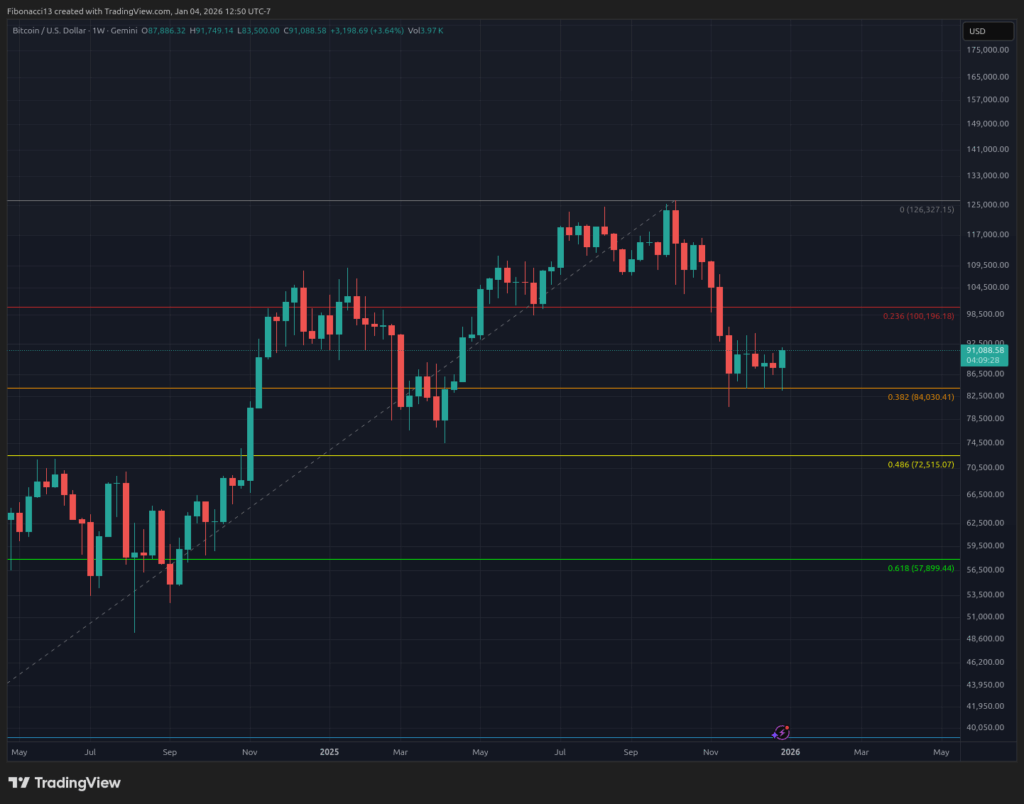
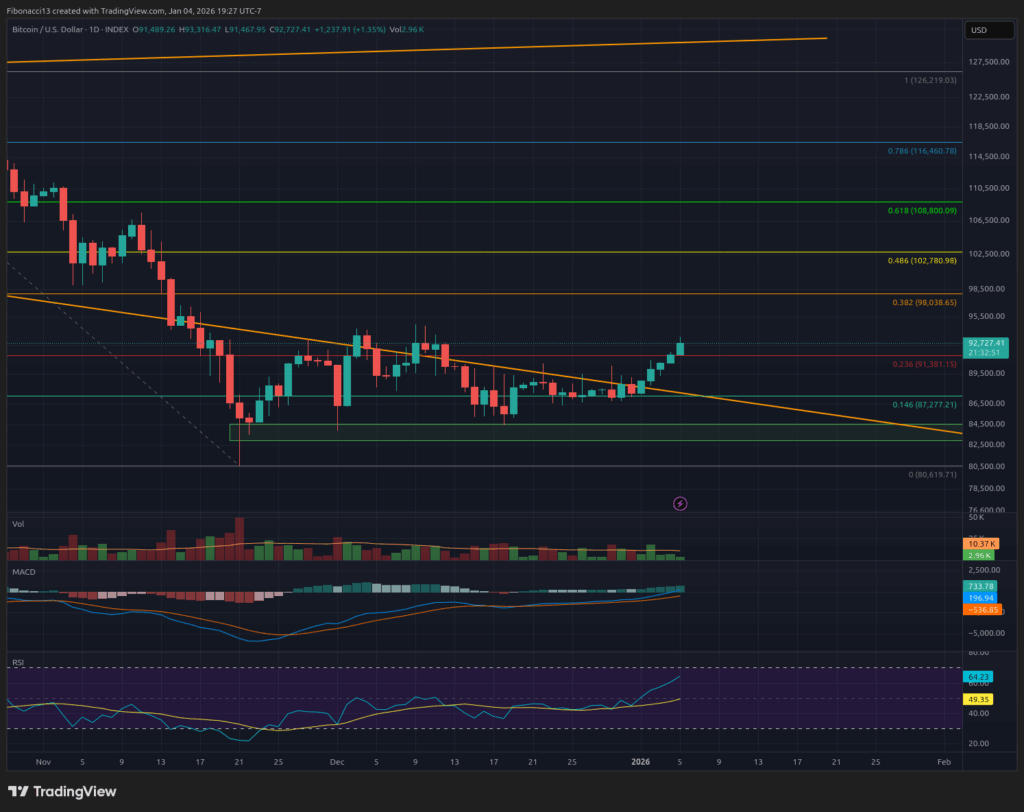
After remaining relatively sideways through the Christmas and New Year’s weeks, the bitcoin price made a small move higher over this past weekend. Bitcoin price closed the week at $91,489, just above the short-term resistance level at $91,400. If bulls can sustain above this level, they should take another run at the $94,000 resistance level this week, which has kept a lid on the price since mid-November. $98,000 is within reach this week as well.
Key Support and Resistance Levels Now
Bulls will try to carry some momentum into the New Year here and take out the $94,000 resistance level. Above $94,000, we have $98,000, where resistance really starts to pick up, and stretches from there all the way up to $103,500. This area is poised well to reject the price if it can climb above $94,000. $109,000 provides a likely final ceiling for the price that will be extremely tough to conquer. If the price gets above $109,000, we can start talking about potentially seeing new highs.
The bulls will want to hold support at $87,000 if the bears can manage to drive the price down there. $84,000 is still strong support below there, but it will weaken with further touches. If $84,000 support fails, we will look down to the $72,000 to $68,000 support zone as a strong level to produce a bounce.
Outlook For This Week
Sleepy bears have let up a little over the past few weeks. This week, the bulls will likely try to take advantage of this by continuing to push the price higher into the next resistance level, so look for the bulls to make another attempt at $94,000. $98,000 should keep a lid on things this week if bulls can manage to push past $94,000. If bulls fail to hold the $91,400 level this week, look for them to defend the $87,000 level to give themselves another attempt at getting above it and taking on $94,000 once again.
Market mood: Neutral – Bulls have managed to hold support levels over the past few weeks and have a bit of upward momentum this week. The bearish mood has softened to a more neutral level.
The next few weeks
The weekly chart has been sandwiched between the lower trend line of the broadening wedge above and the weekly 100 SMA below for several weeks now. One of them had to break, and for now, it is the trend line resistance that has eroded away to give the bulls a chance to push higher. Long-term bias is still bearish, however, so look for any bullish move to find a top over the coming weeks and come back down to test support at $87,000 to $84,000. Closing any weeks below $84,000 at this point will set bears up to drop the price down to the next support level in the low $70,000 range. On the upside, the bulls will need to sustain weekly closes above $100,000 to try to turn the long-term trend around.
Terminology Guide:
Bulls/Bullish: Buyers or investors expecting the price to go higher.
Bears/Bearish: Sellers or investors expecting the price to go lower.
Support or support level: A level at which the price should hold for the asset, at least initially. The more touches on support, the weaker it gets and the more likely it is to fail to hold the price.
Resistance or resistance level: Opposite of support. The level that is likely to reject the price, at least initially. The more touches at resistance, the weaker it gets and the more likely it is to fail to hold back the price.
SMA: Simple Moving Average. Average price based on closing prices over the specified period. In the case of RSI, it is the average strength index value over the specified period.
Broadening Wedge: A chart pattern consisting of an upper trend line acting as resistance and a lower trend line acting as support. These trend lines must diverge away from each other in order to validate the pattern. This pattern is a result of expanding price volatility, typically resulting in higher highs and lower lows.
Fibonacci Retracements and Extensions: Ratios based on what is known as the golden ratio, a universal ratio pertaining to growth and decay cycles in nature. The golden ratio is based on the constants Phi (1.618) and phi (0.618).
This post Bitcoin Weekly Analysis: Momentum Builds Toward $98,000 Amid Neutral Mood first appeared on Bitcoin Magazine and is written by Ethan Greene - Feral Analysis and Juan Galt.


추천 콘텐츠

Pi Network Market Watch: Is May the Turning Point for a Breakout or Just Another Test of Execution?

Pi Network Decentralization Explained The Network Becomes the Body Web3 Consensus Model


