

BNB price targets $1,000 as bullish reversal pattern takes shape ahead of Fermi hard fork
BNB’s price has been in a steady uptrend since the beginning of January. Charts now suggest that a potential breakout past the $1,000 mark could be in play ahead of a major network upgrade.
- BNB price is up 6% over the past week.
- Network upgrades, such as the Fermi hard fork set for next week, have been driving up investor appeal for the token.
- A multi-month ascending triangle pattern has formed on the daily chart.
According to data from crypto.news, BNB (BNB) price has rallied for the fifth straight day, rising nearly 6% in the period. Trading at $907.02 last check, afternoon Asian time, the fifth-largest cryptocurrency by market cap is up nearly 12% from its December low last year.
BNB’s renewed uptrend has been fueled by investor anticipation of the Fermi hard fork event scheduled for Jan. 14.
The upgrade is expected to improve network performance and scalability as it slashes block times to nearly one-third. Besides this, it will also lower transaction confirmation times, optimize EVM efficiency, and reduce node resource requirements through improved indexing.
For the rest of 2026, the BNB team plans to introduce more updates designed to lower fees and improve user experience, in a bid to make the ecosystem more competitive against rivals such as Ethereum and Solana.
Network upgrades like these tend to boost investor sentiment and often trigger upside rallies. In this case, it could support the ongoing uptrend as the crypto market bounces back.
BNB price analysis
On the daily chart, BNB price has been forming an ascending triangle pattern since mid-November last year.
Such a pattern is characterized by a horizontal resistance line connecting similar highs and an upward-sloping support line connecting progressively higher lows, creating a triangular shape. It signals that a potential bullish breakout could be on the horizon as buyers continue to push the price upward against sellers at resistance.
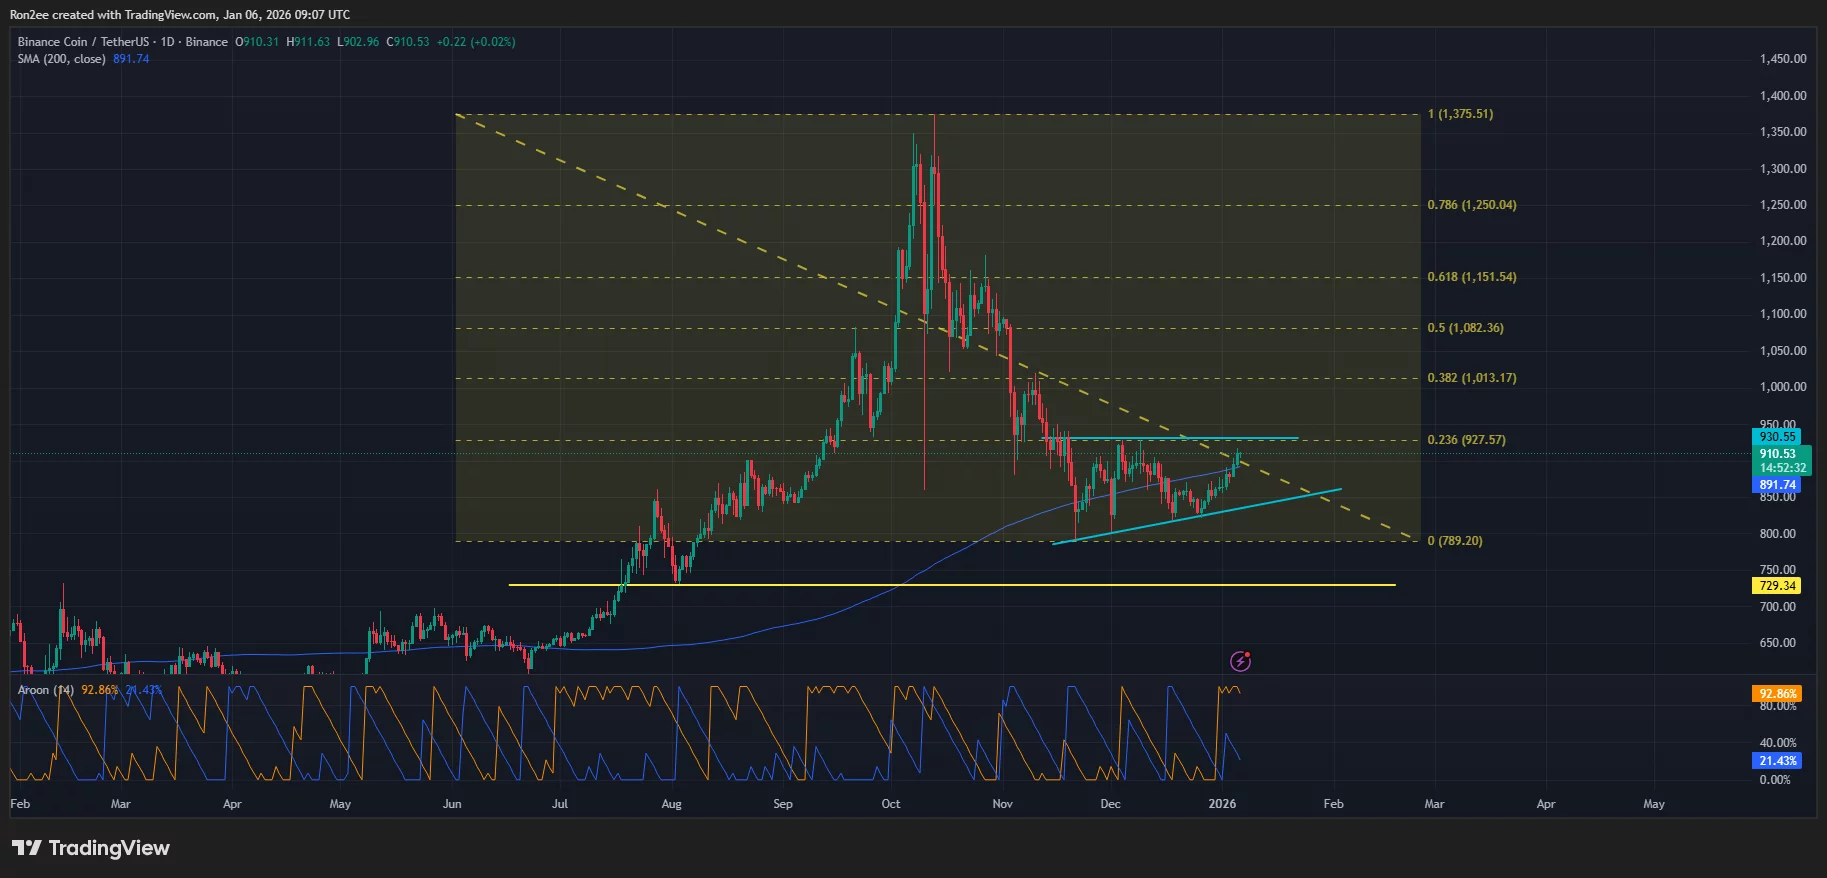
Technical indicators seem to be favoring the bulls. The Aroon up was at 92.86%, while the Aroon down was at 21.43%, suggesting that buying pressure outweighed the influence from sellers at the time of writing.
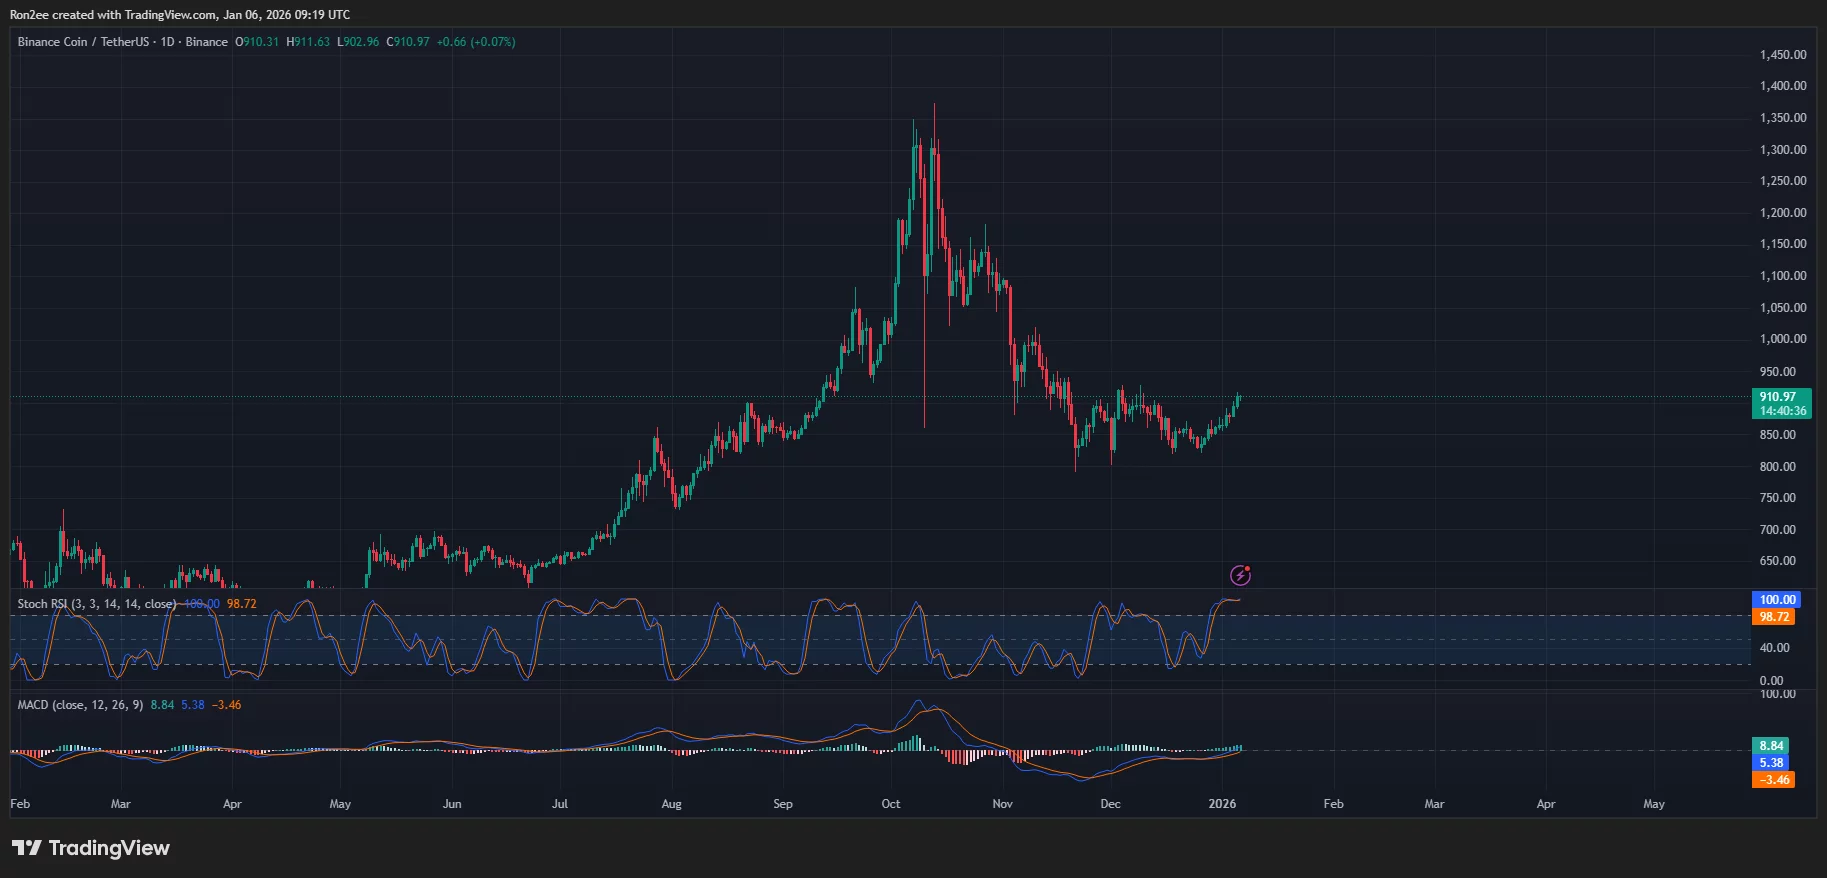
In addition, the MACD also shows a buy signal, though momentum indicators such as the Stochastic RSI suggested some caution in the short term, as it was hovering within overbought levels.
In a bullish scenario, a break above $930 might open the door for a retest of the mid-November high around $1,017. If BNB is unable to maintain support at $891, the 200-day SMA, which sits close to the psychological resistance at $900, will likely serve as the next key support level.
Disclosure: This article does not represent investment advice. The content and materials featured on this page are for educational purposes only.


추천 콘텐츠

CoreWeave (CRWV) Stock Surges 12% on $8.5B GPU-Backed Financing Deal — Here’s the Full Picture

Bitcoin, Gold, and U.S. Stocks Dive as Trump Pledges to Hit Iran ‘Extremely Hard’


