

Bitcoin Makes a Move: Filling Futures Gaps as Price Falls Below $90,000

Bitcoin Dips Below $90,000 Amid Short-Term Technical Movements
Bitcoin (BTC) recently experienced a brief decline below the $90,000 mark, filling one of the two new futures gaps identified in CME trading data. Market analysts suggest this could signal a short-term retracement within the ongoing price cycle, prompting traders to monitor key support levels closely.
Key Takeaways
- Bitcoin is testing the 21-day moving average as it fills open CME futures gaps.
- An additional gap near $88,000 remains, which could serve as a target for further price correction.
- Some analysts view the current gap at $88,000 as potentially marking the cycle’s low, based on technical analysis patterns rather than macroeconomic fundamentals.
- Market sentiment suggests a cautious but technically driven environment with the possibility of bullish reversals if certain support levels hold.
Tickers mentioned: Bitcoin
Sentiment: Neutral
Price impact: Negative. The drop below $90,000 indicates short-term weakness and possible further downside to fill remaining gaps.
Market context: The recent decline aligns with typical technical corrections following strong rally phases, with traders focusing on CME futures gaps as mirrors of short-term support and resistance levels.
Technical analysis shows Bitcoin’s recent stumble below $90,000, which is consistent with filling a CME futures gap at around $89,530. During the Asian trading session, the cryptocurrency briefly traded as low as $89,530 on Bitstamp, highlighting ongoing volatility. Despite this dip, Bitcoin remains aligned with gold, with both assets cooling off after a robust New Year rebound fueled by geopolitical tensions, particularly in Venezuela.
BTC/USD one-hour chart. Source: Cointelegraph/TradingViewCrypto analyst Michaël van de Poppe highlighted the significance of the 21-day moving average, noting that Bitcoin briefly dipped below but could hold this important support level. “It’s hit the 21-Day MA and briefly dipped beneath this level,” he commented on X. “That’s not bad, it can take liquidity, although I’d favor Bitcoin to hold this level.”
Meanwhile, traders like Daan Crypto Trades identified $89,000 and $92,000 as critical levels, suggesting sideways movement until the market establishes a clearer trend. The liquidations map from Binance further emphasizes that traders are currently positioned between these support and resistance zones, with some expecting continued consolidation.
Futures Gap Analysis
Attention remains on the open gap on CME Group’s Bitcoin futures market, which was formed over the New Year period. These gaps often influence short-term price targets, with recent movements filling one of them around $89,530. The next target could be near $88,200 if the price continues downward, aligning with technical expectations.
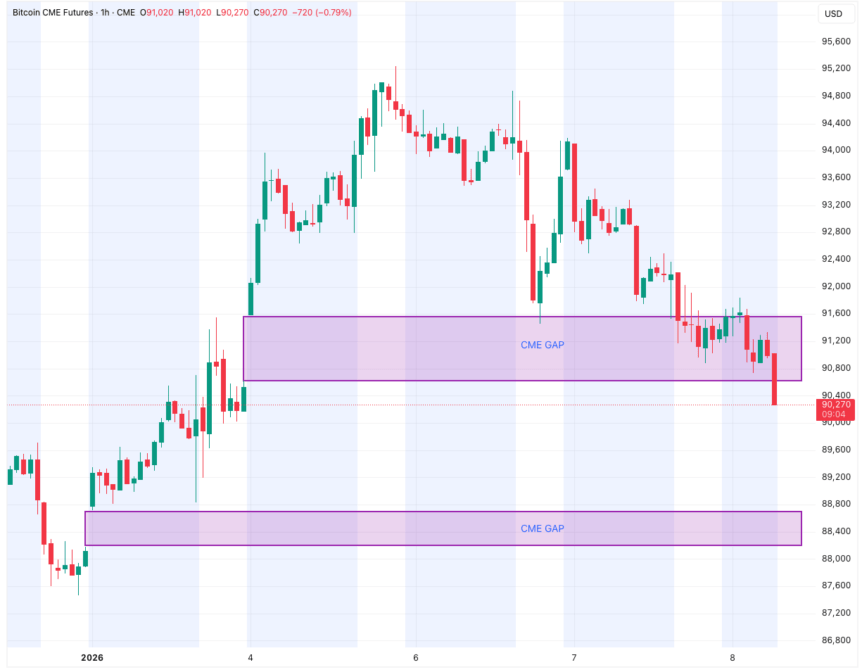 CME Bitcoin futures one-hour chart. Source: Coin Bureau/X
Crypto analyst CW from CryptoQuant emphasized the importance of filling the remaining gap, considering it a “potential risk” for the market’s upward momentum. “For a stable upward trend, it’s best to eliminate this risk and then start the rally,” CW stated. Conversely, he noted that if the gap remains unfilled, it could be indicative of a Cycle bottom around $88,000, suggesting a longer-term outlook remains uncertain.
This article was originally published as Bitcoin Makes a Move: Filling Futures Gaps as Price Falls Below $90,000 on Crypto Breaking News – your trusted source for crypto news, Bitcoin news, and blockchain updates.


추천 콘텐츠

Gold price in India: Rates on April 13

Strategy signals another bitcoin buy as company needs just 2% annual BTC growth to cover dividends


