

Cardano (ADA) Finds Strong Support Near $0.42 As Selling Pressure Fades
Cardano has spent several months under pressure, sliding from the $0.80–$0.90 region down to the low $0.40s. On the weekly ADA/USD chart, price is now trading close to $0.42, an area that has historically acted as a strong demand zone.
According to analyst Trend Rider, this level represents the first meaningful retest of long-term support following a sustained bearish phase, a moment that often carries added technical weight on higher timeframes.
The recent weekly candle charts have long lower wicks and small bodies. This means that selling pressure is weakening, as there are people buying at key support levels.
As of the current trend, it is still bearish, but there are no major selling pressures, possibly transitioning from panic selling to a balanced phase.
Source: X
Also Read: Cardano (ADA) Technical Analysis: Weekly Chart Breakdown Targeting $1.02
Market Structure and Momentum Show Early Stabilization Signs
Structurally, ADA was range-bound in the $0.80-$0.85 area, portraying bearish dominance in the earlier phase. At present, market movements are no longer similar.
Price is supported above the major support level, coupled with diminishing downward momentum. Trend Rider draws attention to the above aspects through the use of the Rider Algo in the indicators.
The weekly oscillators that were deeply oversold are showing a turn, indicating that the sellers are exhausted, as opposed to them having some fresh momentum.
Of course, it doesn’t indicate a reversal in a trend yet, but it does indicate a superior risk environment for trading positions as long as it maintains support levels. The relief rally at this point would be short-term unless ADA can return to higher levels.
Indicators Point to Range Trading With a Slight Bearish Bias
Volatility has been continuously shrinking in the weekly chart. Bollinger Bands are compacting, and the price is hovering around the median level, which confirms equal strength of both sides.
In the past, such a pattern on the chart of Cardano was previously followed by stronger price movements, but there is still no clear direction.
The MACD is below its signal line and is negative, which indicates that it has weak momentum and does not seem to be gathering strength. Additionally, the RSI is only in the 30s, which indicates that the price is under the control of the selling pressure, but it is not oversold.
Source: Tradingview
In order to improve the sentiment, ADA would have to perform above $0.50 to $0.55 and demonstrate good momentum. On the flip side, if a strong close is seen below the lower support zone on a weekly basis, traders will once again turn their focus to the trend continuing.
Also Read: Cardano (ADA) On-Chain Governance Sparks Bullish Outlook With $0.90 in Focus


추천 콘텐츠

South Korean Gaming Company NXC Decides to Reduce Its Crypto Holdings! Here Are the Details
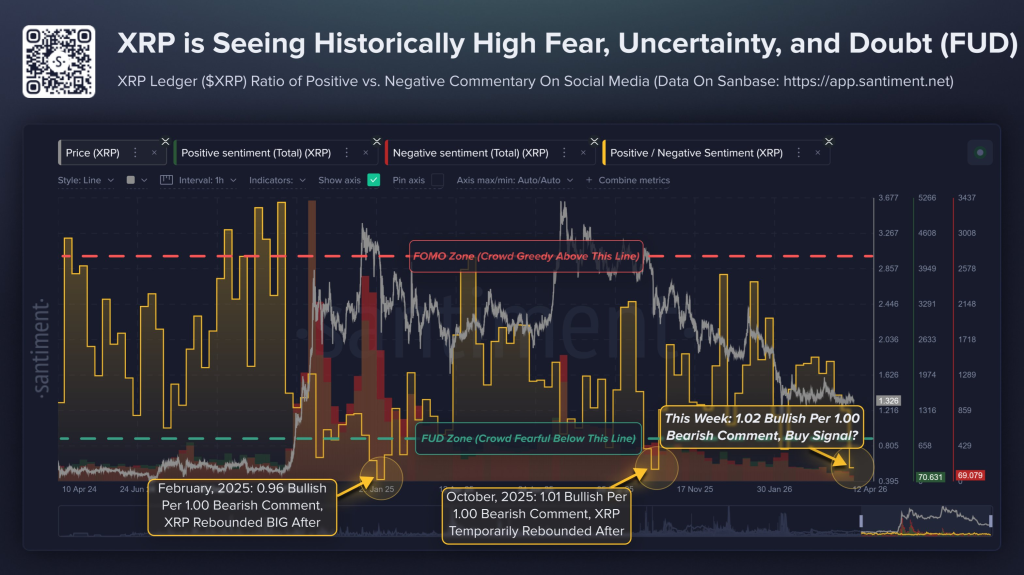
XRP Sentiment Just Flashed a Rare Contrarian Signal – Here’s What Happened the Last Two Times


