

Litecoin (LTC) Price Stalls Near $82 As Long-Term Chart Signals Major Breakout Setup
Litecoin continues to trade in a cautious zone as the broader market looks for clearer direction. On the weekly chart, LTC is hovering around the $81–82 area, showing little urgency from either buyers or sellers.
The volatility and momentum indicators present a calm scenario. On the chart for the current week, the volatility bands for the coin are quite wide since the top band is around $124 and the lower band is around $67.
The major part of the chart lies in the bottom half of the band. This indicates the dominant presence of sellers. However, the price action has not been strong towards the bottom band.
Source: Tradingview
Structurally, Litecoin is ranged between support levels of $75-$70 and resistance levels of $95-$100. A close below support levels on a weekly basis may push the price towards the mid-$60s, where the lower Bollinger Band and demand levels intersect.
For an upward move, a strong re-establishment of the 20-week moving average with strong volume is required to trigger a break towards $110 and potentially towards $125. Until then, every upside move is likely to remain corrective.
Also Read: Litecoin Defends Critical 2017 Support as $1,000 Target Strengthens
Structure Keeps Litecoin Locked Between Key Levels
From a technical point of view, Litecoin is seen ranging between the support of $75-70 and the resistance of $95-100. In the event of a close at the support levels for the week, a further decline may occur, with the ultimate target possibly at the middle $60s.
To regain the upside path, a strong break above the 20-week average with good volume will be required. This will make the path open for the price at $110 with a target of $125.
Long-Term Compression Signals Potential Expansion
When looking out past this short-term weakness, a bigger-picture perspective shows a more patient outlook. As Trader JB has recently illustrated, notice how aberrational Litecoin’s long-term trend has become with not one but two successive triangle patterns and a formation that conforms to a typical W-X-Y correction. In a long-term chart perspective, Litecoin has formed a contracting triangle formation from the peak in 2018.
Source: X
Such a level of compression generally illustrates the manner in which the buyers are assimilating the supply. For as long as Litecoin maintains its position above the supports that are between $70-80, the market outlook remains positive.
Once it manages to break above the long-term resistance level, it will be able to transit from the current phase of consolidation to the expansion phase, which it exhibited in the past.
Also Read: Litecoin (LTC) Consolidates Above Key Support: Is a Rally Toward $140 Next?


추천 콘텐츠

South Korean Gaming Company NXC Decides to Reduce Its Crypto Holdings! Here Are the Details
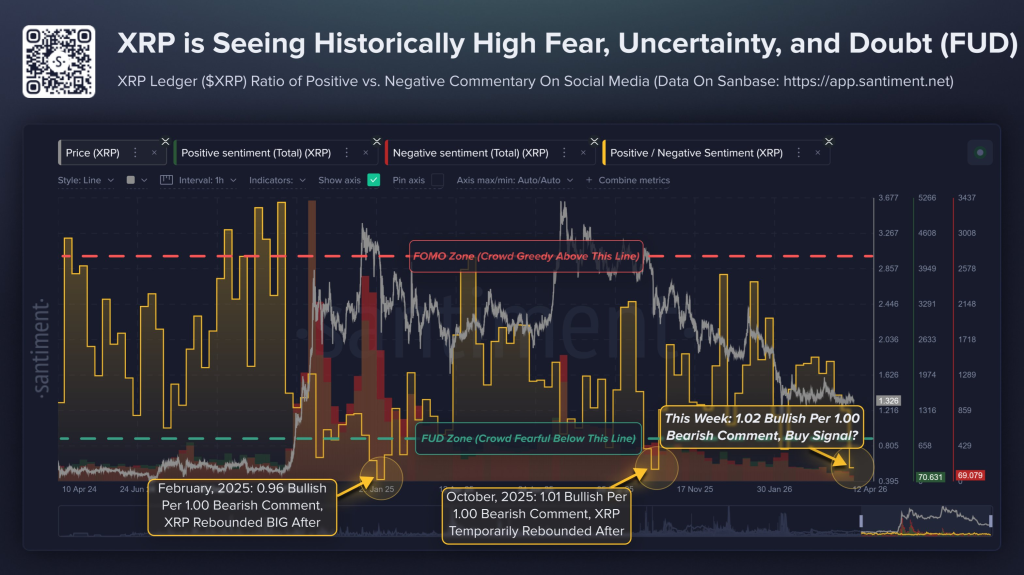
XRP Sentiment Just Flashed a Rare Contrarian Signal – Here’s What Happened the Last Two Times


