A Bearish Wall Looms Over BONK: Fade Lower or Fight Back for Gains?
- After an 8% dip, BONK is trading near $0.000010.
- Its daily trading volume has dropped by 32%.
2.66% loss invites solid red waves across the digital assets, with their prices losing momentum, falling to former lows. Meanwhile, the meme coin market cap is settled at $48.50 billion, after dropping over 8% in the last 24 hours. Most of the prominent meme coins are hovering on the downside. Significantly, the Solana-based BONK has faced a loss of 8.29%.
The meme coin has traded on the upside, at around $0.00001176 in the early hours. Gradually, the bearish shift in the BONK market pushed the price to descend toward a low range of $0.0000106. If the asset continues to hold with the downside trading pattern, it might witness more losses, entering the red zone.
The CoinMarketCap data has reported that BONK trades within the $0.00001061 zone, at the time of writing, with the market cap touching $937.57 million. In addition, the daily trading volume of the meme coin has decreased by over 32.26%, likely reaching the $185.27 million mark.
BONK Faces Bearish Pressure as Technicals Slide
The four-hour technical analysis of BONK highlights the bearish shift, with the Moving Average Convergence Divergence (MACD) line situated below the signal line. The upside momentum is weakening, and if the gap widens, it confirms continued pressure on the downside.
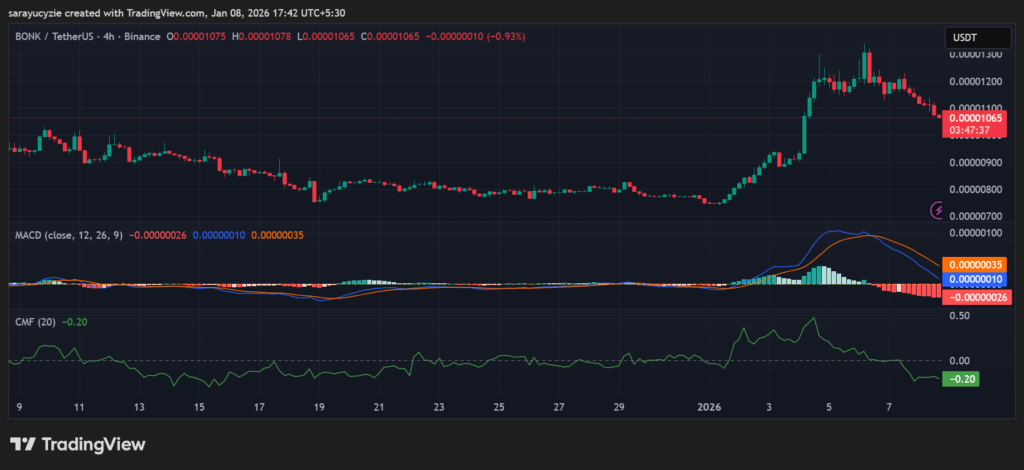 BONK chart (Source: TradingView)
Moreover, the Chaikin Money Flow (CMF) indicator at -0.20 brings selling pressure in the meme coin market. Also, the capital is flowing out of the asset, but it is not extremely bearish. The sustained negative value confirms weak demand and often supports further downside.
BONK’s ongoing market sentiment is weak to neutral, as the Relative Strength Index (RSI) is at 42.74. The asset is neither oversold nor overbought, but the momentum leans slightly bearish, and the price may continue to drift lower unless it moves back above 50. Notably, the Bull Bear Power (BBP) reading of -0.00000117 shows very weak bearish dominance. As it is extremely close to zero, neither bulls nor bears have clear control, and the price may move sideways until a stronger trend emerges.
The price chart of BONK exhibits a bearish correction, and the price might fall and test the support range at $0.00001050. An extended loss could trigger the death cross emergence, driving the price below $0.00001039. On the support side, assuming the meme coin reverses the momentum, the price could climb to its nearest resistance at the $0.00001072 level. A steady bullish pressure might initiate the formation of the golden cross, and send the BONK price above $0.00001083.
Top Updated Crypto News
Zcash (ZEC) Stumbles 18%: Can It Find Its Footing, or Is the Downtrend Far From Over?


추천 콘텐츠

Best Music AI Websites For Songs And Soundtracks

Anthropic code leak exposes Claude AI internals after release error