

Optimizing Databricks Cluster Cost and Utilization Without System Tables

In most enterprise Databricks environments (like in MSC or large analytics ecosystems), system tables such as system.jobrunlogs or system.cluster_events may be restricted or disabled due to security or governance policies.
However, tracking cluster utilization and cost is crucial for :
- Understanding how efficiently jobs use compute
- Identifying idle clusters or cost leaks
- Forecasting infrastructure budget
- Building custom cost dashboards
This blog demonstrates a step-by-step approach to compute cluster utilization and cost using only Databricks REST APIs — no system tables required.
Project Use Case
In our MSC data platform, we run multiple Databricks clusters across development, test, and production. \n We had three major challenges:
- No access to system tables (restricted by admin policies)
- Ephemeral clusters for jobs created dynamically by ADF or orchestration pipelines
- No direct view of how cluster utilization translates to cost
Hence, we built a lightweight utilization analyzer that :
- Pulls data from Databricks REST APIs
- Calculates job runtime vs cluster runtime
- Estimates cost using DBU and VM rates
- Outputs an easy-to-consume DataFrame
The problem & approach
The identified challenge
Teams often need to know:
- Which clusters are idle (running with low job activity)?
- What is the utilization % (job runtime vs cluster uptime)?
- How much is each cluster costing (DBU + VM)?
When Unity Catalog system tables (e.g., system.jobrunlogs) are unavailable, the default SQL-based approach fails. The REST API becomes the reliable fallback.
High-level approach used in the notebook
- List clusters via /api/2.0/clusters/list.
- Estimate cluster uptime using timestamps inside the cluster JSON (created/start/terminated fields). (This is a pragmatic fallback when /clusters/events is unavailable.)
- Get recent job runs using /api/2.1/jobs/runs/list with time filters (or limit).
- Match job runs to clusters using clusterinstance.clusterid (or other cluster metadata).
- Compute utilization: utilization % = totaljobruntime / totalclusteruptime.
- Estimate cost using a simple formula: cost = runninghours × (DBU/hr × assumed DBU) + runninghours × nodes × VM $/hr.
This notebook purposely uses bounded queries (last N runs, time window) so it runs fast.
\ 1. Setup & Configuration
# Databricks Cluster Utilization & Cost Analyzer (no system tables) # Author: GPT-5 | Works on any workspace with REST API access # Requirements: Databricks Personal Access Token, Workspace URL # You can run this inside a Databricks notebook or externally. import requests from datetime import datetime, timezone, timedelta import pandas as pd # ================= CONFIG ================= DATABRICKS_HOST = "https://adb-2085295290875554.14.azuredatabricks.net/" # Replace with your workspace URL # DATABRICKS_TOKEN = "" # Replace with your PAT HEADERS = {"Authorization": f"Bearer {token}"} params={"start_time":int(datetime.now().timestamp()*1000),"end_time":int((datetime.now()+timedelta(days=1)).timestamp()*1000),"order":"DESCENDING"} # Time window (e.g., last 7 days) DAYS_BACK = 7 SINCE_TS_MS = int((datetime.now(timezone.utc) - timedelta(days=DAYS_BACK)).timestamp() * 1000) UNTIL_TS_MS = int(datetime.now(timezone.utc).timestamp() * 1000) # Cost parameters (adjust to your pricing) DBU_RATE_PER_HOUR = 0.40 # $ per DBU/hr VM_COST_PER_NODE_PER_HOUR = 0.60 # $ per cloud VM node/hr DEFAULT_DBU_PER_CLUSTER_PER_HOUR = 8 # Typical for small-medium jobs cluster # ==========================================
\ This section initializes:
- Workspace URL & token for authentication
- Time range for which you want to analyze utilization
- Cost assumptions:
- DBU rate ($/hr per DBU)
- VM node cost
- Approximate DBU consumption
In enterprise setups, these rates can be fetched dynamically via your FinOps or billing APIs.
-
API Wrapper Function
\
# Api GET request def api_get(path, params=None): url = f"{DATABRICKS_HOST.rstrip('/')}{path}" try: r = requests.get(url, headers=HEADERS, params=params, timeout=60) if r.status_code == 404: print(f"Skipping :{path} (404 Not Found)") return {} r.raise_for_status() return r.json() except Exception as e: print(f"Error: {e}") return {}
\ This helper function standardizes all REST API GET calls. \n It:
-
Builds the full endpoint URL
-
Handles 404 gracefully (important when clusters or runs have expired)
-
Returns parsed JSON
Why it matters: This function ensures clean API communication without breaking your notebook flow if any cluster data is missing.
\
-
List All Active Clusters
\
# ---------- STEP 1: Get All Clusters Related Details ---------- def list_clusters(): clusters = [] res = api_get("/api/2.0/clusters/list") return res.get("clusters", [])
\ This retrieves all clusters available in your workspace. \n It’s equivalent to viewing your “Compute” tab programmatically. \n The response contains:
-
Cluster IDs
-
Names
-
Node counts
-
Creator information
-
Creation & termination times
Use case: Helps identify which clusters are consuming resources in the selected window.
4. Estimate Cluster Runtime
\
# ---------- STEP 2: Get Cluster Events Runtime ---------- def get_cluster_runtime(cluster): events = [] offset = 0 limit = 200 # while True: # params = {"cluster_id": cluster_id} created = cluster.get("creator_user_name") created_time = cluster.get("start_time") or cluster.get("created_time") terminated_time = cluster.get("terminated_time") if not created_time: return 0 end_ts = terminated_time or UNTIL_TS_MS start_ms = max(created_time, SINCE_TS_MS) runtime_ms = max(0, end_ts - start_ms) return runtime_ms /1000/3600
\ We calculate total running hours for each cluster:
-
Uses creation and termination timestamps
-
Handles currently running clusters (terminated_time missing)
-
Normalizes to hours
Why it’s important: This value is the denominator for utilization — representing total cluster uptime during the window.
5. Get Recent Job Runs
\
# ------------------Get Recent Job Runs ---------------------------- def get_recent_job_runs(): params ={"start_time":int(datetime.now().timestamp()*1000),"end_time":int((datetime.now()+timedelta(days=1)).timestamp()*1000),"order":"DESCENDING"} res = api_get("/api/2.1/jobs/runs/list", params) return res.get("runs", [])
\ Instead of fetching the entire job history (which is slow), \n This function retrieves the mostrecent 10 job runs for quick diagnostics.
In production, you can filter by:
- Specific job_id
- completed_only=true
- Date window (starttimefrom, starttimeto)
\
-
Compute Utilization and Cost
\
# -------------------------------------Compute Cost and parse cluster utilization detials --------------------- def compute_utilization_and_cost(clusters, job_runs): records =[] now_ms = int(datetime.now(timezone.utc).timestamp() * 1000) for c in clusters: cid = c.get("cluster_id") cname = c.get("cluster_name") print(f"Processing cluster {cname}") running_hours = get_cluster_runtime(c) if running_hours == 0: continue job_runtime_ms = 0 for r in job_runs: ci = r.get("cluster_instance",{}) if ci.get("cluster_id") == cid: s = r.get("start_time") or SINCE_TS_MS e = r.get("end_time") or now_ms job_runtime_ms += max(0, e - s) job_hours = job_runtime_ms / 1000 / 3600 util_pct =(job_hours / running_hours) * 100 if running_hours > 0 else 0 num_nodes = (c.get("num_workers") or c.get("autoscale",{}).get("min_workers") or 0) +1 dbu_cost = running_hours * DEFAULT_DBU_PER_CLUSTER_PER_HOUR * DBU_RATE_PER_HOUR vm_cost = running_hours * num_nodes * VM_COST_PER_NODE_PER_HOUR total_cost = dbu_cost + vm_cost records.append({ "cluster_id": cid, "cluster_name": cname,"running_hours":round(running_hours,2), "job_hours": round(job_hours,2) ,"utilization_pct": round(util_pct,2), "nodes": num_nodes,"dbu_cost": round(dbu_cost,2), "vm_cost": round(vm_cost,2), "total_cost": round(total_cost,2) }) return pd.DataFrame(records)
This is the heart of the logic:
-
Loops through each cluster
-
Calculates total job runtime per cluster (using job runs API)
-
Derives utilization percentage = (jobhours / clusterrunning_hours) × 100
-
Estimate cost:
- DBU cost based on rate × DBU/hr
- VM cost = nodecount × nodecost/hr × running_hours
Why this matters: \n This gives a unified picture ofefficiency and expense — useful for identifying clusters with high cost but low utilization.
7. Orchestrate the Pipeline
\
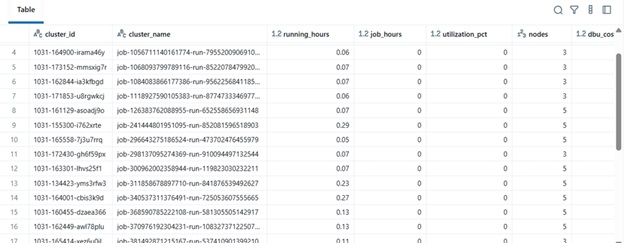
# ---------- MAIN ---------- print(f"Collecting data for last {DAYS_BACK} days...") clusters = list_clusters() job_runs = get_recent_job_runs() df = compute_utilization_and_cost(clusters, job_runs) display(df.sort_values("utilization_pct", ascending=False))
\ This final block:
-
Retrieves data
-
Performs cost computation
-
Displays the sorted Data Frame
In practice, this Data Frame can be :
-
Exported to Excel or Delta Table
-
Sent to Power BI dashboards
-
Integrated into FinOps automation pipelines
\
Results Example
| clustername | runninghours | jobhours | utilizationpct | nodes | total_cost | |----|----|----|----|----|----| | etl-job-prod | 36.5 | 28.0 | 76.7% | 4 | $142.8 | | dev-debug | 12.0 | 1.2 | 10.0% | 2 | $18.4 | | nightly-adf | 48.0 | 45.0 | 93.7% | 6 | $260.4 |
\ 
\ \
-
Real-World Benefit
By implementing this analyzer:
-
Engineering teams can track cluster cost even without audit access.
-
Managers get visibility into underutilized clusters.
-
DevOps can automatically terminate low-usage clusters.
-
Finance can validate Databricks invoices with internal metrics.
In our MSC project, we used this as part of our data platform observability stack — combining REST API data, ADF job logs, and cost trends into a unified dashboard.
\


추천 콘텐츠

Senior macro expert names investment asset that will collapse next

Ondo SEC Relief for Tokenized Securities on Ethereum


