Bitcoin Bears Hold $94K Resistance as Price Drops to $90,891 Weekly Close
Bitcoin Magazine
Bitcoin Bears Hold $94K Resistance as Price Drops to $90,891 Weekly Close
Bitcoin Price Weekly Outlook
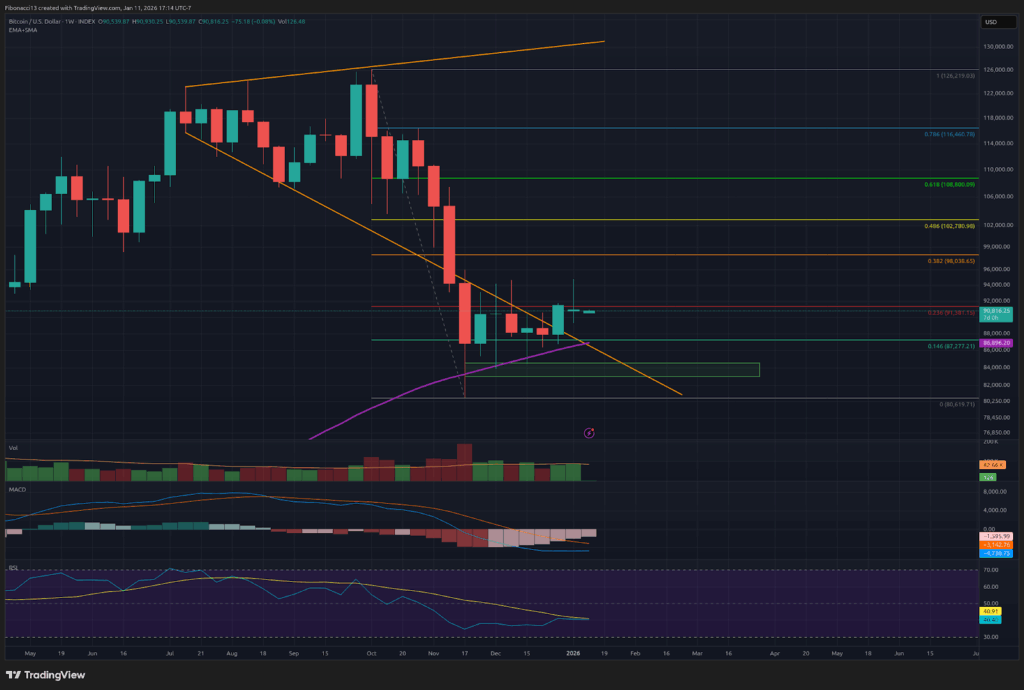
Bitcoin buyers made a nice push to $94,000 resistance again last week, but the price promptly sold off again from this level to close the week out at $90,891. Sunday’s close gave us a doji candle, indicating indecision and a potential reversal back in the bears’ favor. The bulls are once again looking lethargic as they lack the follow-through necessary to overtake resistance. Bears are in the driver’s seat heading into this week. Look for them to try to push the price down through the $87,000 support level to make another attempt at breaking $84,000 support.
Key Support and Resistance Levels Now
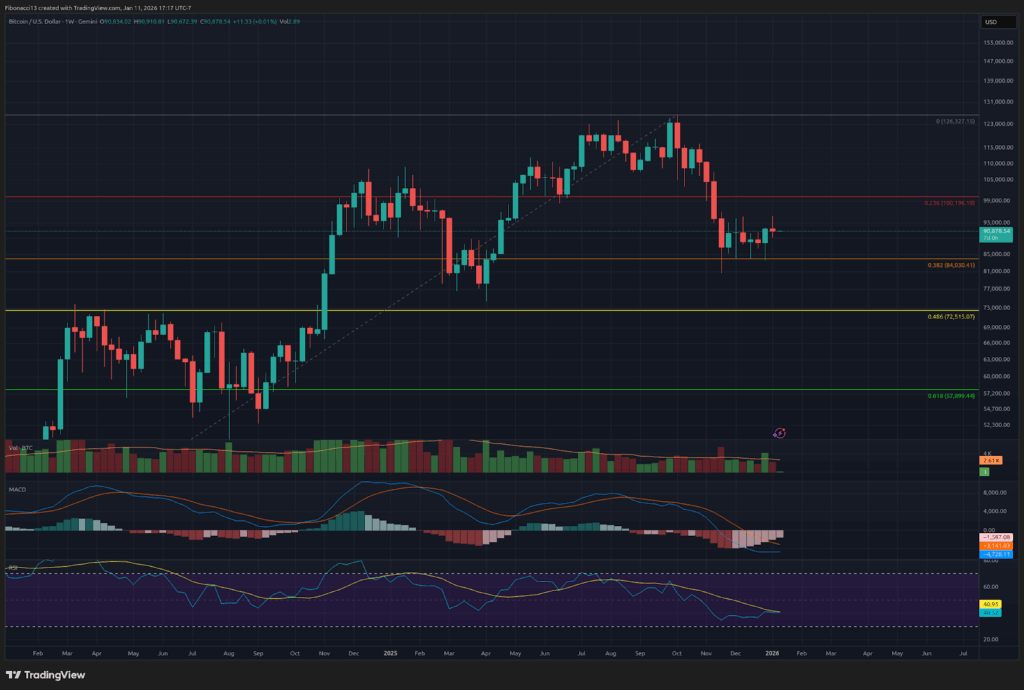
The bulls are looking for support at the $87,000 level to hold if bears manage to keep the push lower going here. $84,000 still sits as strong support below here, but will weaken with any further pressure. If the bears can manage to break this support, the price is sure to accelerate down to the low $70,000 area, with a close below $68,000 required to lose this support level. Below this zone, bulls will look to gain some sort of strength off the 0.618 Fibonacci retracement at $58,000.
Bears will look to defend the $91,400 level as resistance over the short term here. The resistance at $94,000 has done its job so far, but it will be under heavy pressure if bulls can muster the strength to get the price back up there. Above $94,000, there is a resistance zone that stretches from $98,000 up to $103,500. Above here, we have another resistance zone from $106,000 up to $109,000 at the 0.618 Fibonacci retracement from the drop from the top down to $80,000.
Outlook For This Week
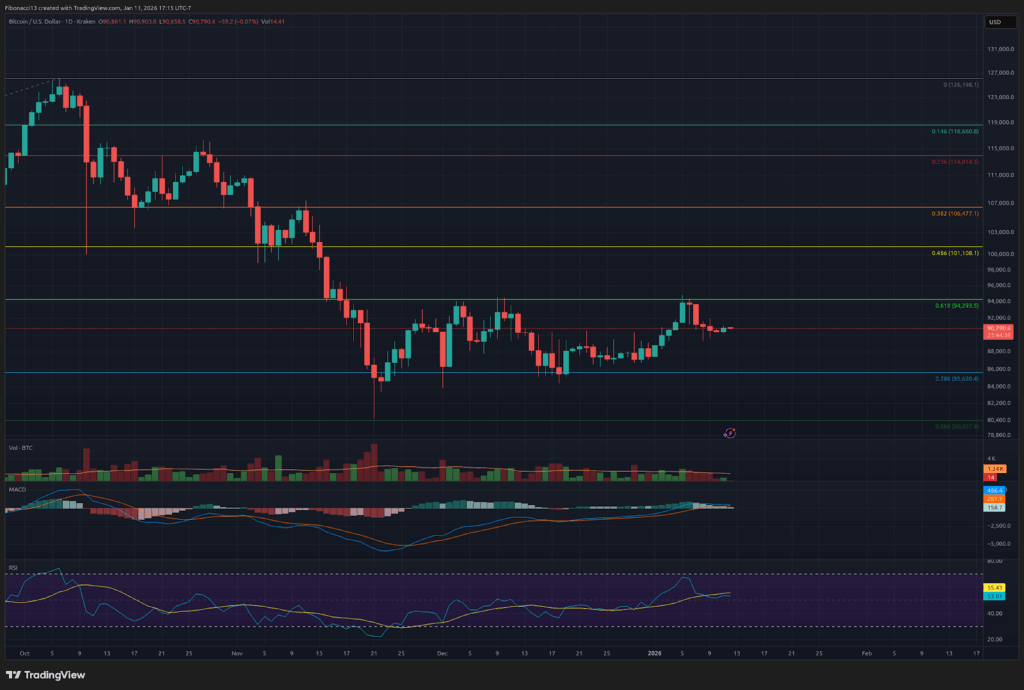
Wounded bulls need some help to hang on to momentum this week. Look for the bears to push the price down to $87,000 early in the week and possibly below it. Bulls will try to stop the price from closing any days below $87,000. If the bears manage a daily close below here, $84,000 support will be under heavy threat, and the bulls will need buyers to step up to the plate with some big volume to hold this support level once again.
Market mood: Bearish – After a weekly shooting star doji candle close, the bulls’ momentum has faded. The bears have tilted control slightly in their favor to start this week.
The next few weeks
Price action may remain choppy and confined within a range over the next few weeks. Bulls need to see a close above $94,000 to break above this range and look for upward momentum, while bears need to see a close below $84,000 to try to break down below this major support level. Between $94,000 and $84,000 is now a neutral zone, where bulls and bears may battle back and forth. Neither side is poised to take firm control of the price action until either of these boundaries is broken.
Terminology Guide:
Bulls/Bullish: Buyers or investors expecting the price to go higher.
Bears/Bearish: Sellers or investors expecting the price to go lower.
Support or support level: A level at which the price should hold for the asset, at least initially. The more touches on support, the weaker it gets and the more likely it is to fail to hold the price.
Resistance or resistance level: Opposite of support. The level that is likely to reject the price, at least initially. The more touches at resistance, the weaker it gets and the more likely it is to fail to hold back the price.
Shooting Star Candle: A candlestick that occurs after an uptrend, marked by a long wick upwards above the candle body and a smaller wick (or no wick) to the downside. The long wick up indicates strong selling near the highs. This candle can often indicate the end of an uptrend.
Doji Candle: A candlestick that closes at nearly the same price at which it opened. This candle indicates indecision, and can signal a reversal in price action if it occurs after an uptrend or downtrend.
Fibonacci Retracements and Extensions: Ratios based on what is known as the golden ratio, a universal ratio pertaining to growth and decay cycles in nature. The golden ratio is based on the constants Phi (1.618) and phi (0.618).
This post Bitcoin Bears Hold $94K Resistance as Price Drops to $90,891 Weekly Close first appeared on Bitcoin Magazine and is written by Ethan Greene - Feral Analysis and Juan Galt.


추천 콘텐츠

Wildcoins Review – Get UPTO 3.5 BTC for Free

SOL and XRP Show Deeper Unrealized Losses Compared to BTC & ETH