

Altcoin Season Indicators: Ethereum Rockets 21%, XRP Hits ATH as Bitcoin Dominance Wanes
Bitcoin’s dominance is starting to slip as capital flows into a broader set of digital assets. From Ethereum’s sharp breakout to the resurgence of meme coins, the market has entered a phase of visible diversification. This raises a familiar question: Is an altcoin season underway?
While the term often generates hype, verifying its arrival requires more than anecdotal gains. This analysis examines current price action, dominance metrics, and altcoin season indicators to assess whether the shift is technical noise or the beginning of a deeper rotation.
Performance Snapshot: Ethereum, XRP, and Meme Tokens
Ethereum surged from under $3,100 to over $3,750 in the first three weeks of July 2025, according to CoinMarketCap. The move coincided with a wave of liquidations and rising ETH inflows, especially into derivatives platforms. Market watchers tied the rally to anticipation around scaling upgrades and ETH’s improving market share.
XRP outperformed even more dramatically. On July 17, it breached its previous all-time high, touching $3.49 before retreating slightly. CoinMarketCap data confirms this level marked a new price discovery zone, aided by regulatory clarity in Asia and adoption by financial services platforms. It is currently trading at $3.61.
DOGE also participated in the rally. While not reaching new highs, it climbed nearly 40% in a two-week window, driven by retail enthusiasm and Elon Musk’s renewed social mentions. This broader participation suggests the rally was not limited to high-cap utility tokens alone.
Interpreting the Climb with Altcoin Season Index
As of July 21, the Altcoin Season Index—tracked by Blockchaincenter—stands at 59. This index measures the number of top 50 coins outperforming Bitcoin over the last 90 days. While 75 is the official “altcoin season” threshold, the current level marks a steep climb from 28 in early June.
It shows a shift in relative strength, especially when paired with falling Bitcoin dominance. The trend is clear, even if the season isn’t official yet.
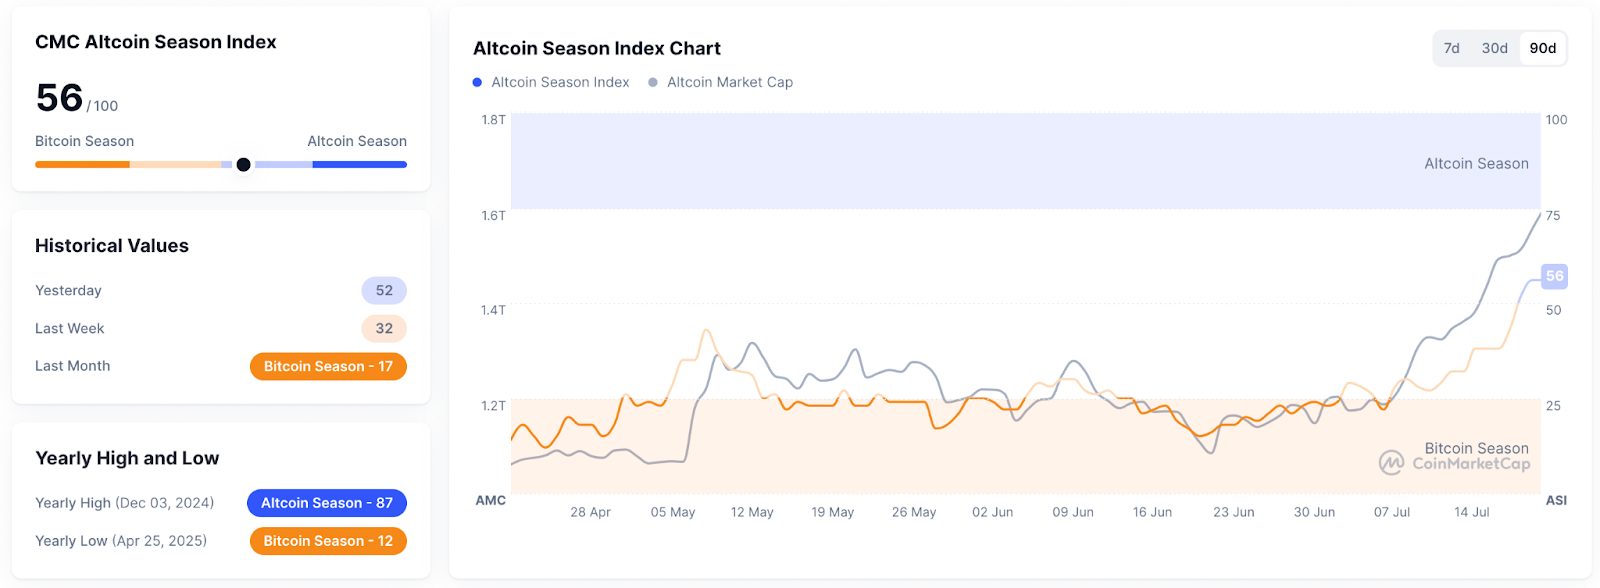
CMC Altcoin Season Index (Source: CoinMarketCap)
Similarly, the CMC Altcoin Season Index tracks the performance of 100 altcoins relative to Bitcoin for the past 90 days and is currently showing a reading of 56.
Bitcoin Dominance and Capital Migration
Bitcoin dominance dropped to 60.49% this week, its lowest level since March, according to TradingView’s BTC.D chart. The decline mirrors the expanding inflows into Ethereum, meme assets, and select infrastructure tokens.
Historically, BTC.D falling below 50% has marked a transition toward broader risk appetite. ETH’s share of total market cap rose 1.5% in July, while DeFi tokens like AAVE and UNI posted double-digit weekly gains.
These shifts show a familiar pattern: capital exits Bitcoin for potentially higher-yield altcoins when market sentiment turns risk-on. That behavior is now repeating, albeit more selectively than in prior cycles.
Infrastructure Tokens and the Flight to Utility
Analysts are flagging a parallel theme beneath the meme hype: a rotation into infrastructure plays with perceived longevity.
Chainlink (LINK), trading around $19, is attracting institutional interest again. LINK’s cross-chain interoperability could be seen as essential to upcoming RWAs and enterprise integrations.

Cardano (ADA) Price (Source: CoinMarketCap)
Cardano (ADA) has risen by more than 50% over the past month, buoyed by recent ecosystem launches and expanded stablecoin options. ADA’s sustained community development and regulatory alignment could be factors in its rebound.
Avalanche (AVAX), also up 50% over the past 30 days, is being watched for subnetwork upgrades. Analysts argue that these layer-1s are regaining traction not as Ethereum killers but as specialized tools for selective growth sectors.
A Measured But Shifting Environment
A full altcoin season is not yet confirmed. But with rising participation, declining BTC dominance, and renewed attention on utility-based tokens, the conditions are forming. If momentum continues, the coming weeks could mark a decisive phase in crypto’s internal capital rotation.
Altcoin market cycles often move in phases, with early breakouts in majors like ETH and XRP followed by delayed gains in mid- and small-cap tokens. If historical patterns hold, the current broadening could indicate a more sustained altcoin-led period.
However, volatility remains high, and sector rotations can reverse quickly. Investors should continue monitoring key indicators like dominance, volume flows, and relative strength to navigate what may be the early innings of an altcoin resurgence.


추천 콘텐츠

Senators highlight 'nonnegotiable' threat in letter to Trump

ICE-involved shooting shuts down part of interstate as FBI launches investigation


