

What Are Ethereum Whales Up To as ETH Trades Below Their Cost Basis: Accumulating or Distributing?

The post What Are Ethereum Whales Up To as ETH Trades Below Their Cost Basis: Accumulating or Distributing? appeared first on Coinpedia Fintech News
The Ethereum price has just slid below $2000 as the broader market sentiments have dropped, with the Bitcoin price plunging below $67,000. The latest data indicates the value of the second-largest token has dropped below the average cost basis of the whales. This has been a decisive moment in the past that has triggered deeper sell-offs or marked the beginning of a strong accumulation phase.
Recent on-chain data reveals mixed signals. Accumulation addresses are increasing inflows, and staking participation continues to rise, yet some large wallets have trimmed holdings. At the same time, a massive leveraged long has entered the market, adding another layer of risk.
Now that the large holders are experiencing unrealized loss, the question arises: What are Ethereum whales doing now? Are they quietly adding to the position while the ETH price remains under pressure, or are they reducing exposure and redistributing supply?
ETH Trading Below Whale Realized Price—Why It Matters
The realized price for whales is the average on-chain cost basis of large holders, typically wallets holding a defined minimum balance. It shows where whales, as a group, last accumulated their coins. When Ethereum trades below the realized price of accumulation wallets, it means long-term holders are underwater. This often creates two outcomes: panic selling or aggressive averaging down.
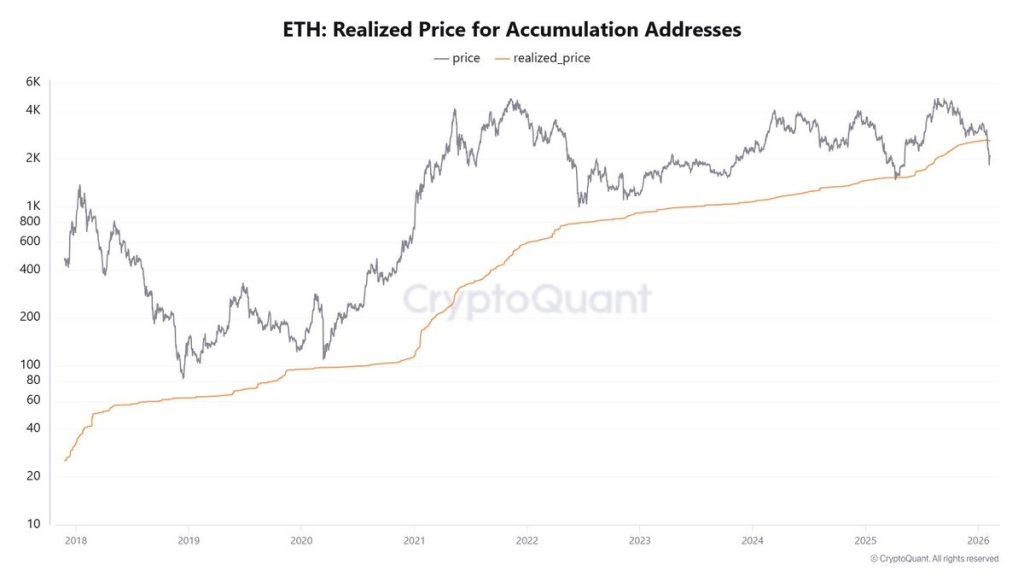
Historically, sustained trading below whale realized price signals structural weakness and slower recoveries. Quick reclaim, however, often marks local bottoms, as whale demand absorbs panic selling. On the other hand, the inflows into these accumulation addresses are increasing, which signals conviction rather than capitulation. The whales appear to be adding exposure despite short-term weakness, reflecting a long-term bullish outlook.
1,000+ ETH Wallets Reduce Holdings—Distribution or Rotation?
On the other hand, there has been a clear shift in the Ethereum supply ownership. The data from Santiment shows that large wallets or whales, have been reducing their exposure, where the total supply has dropped below 75% for the first time in the past seven months. According to the chart, these whales have offloaded roughly 1.5% of the total ETH supply over the last 11 weeks, which lines up with the broader price weakness. That’s classic distribution into strength, not aggressive dip-buying.
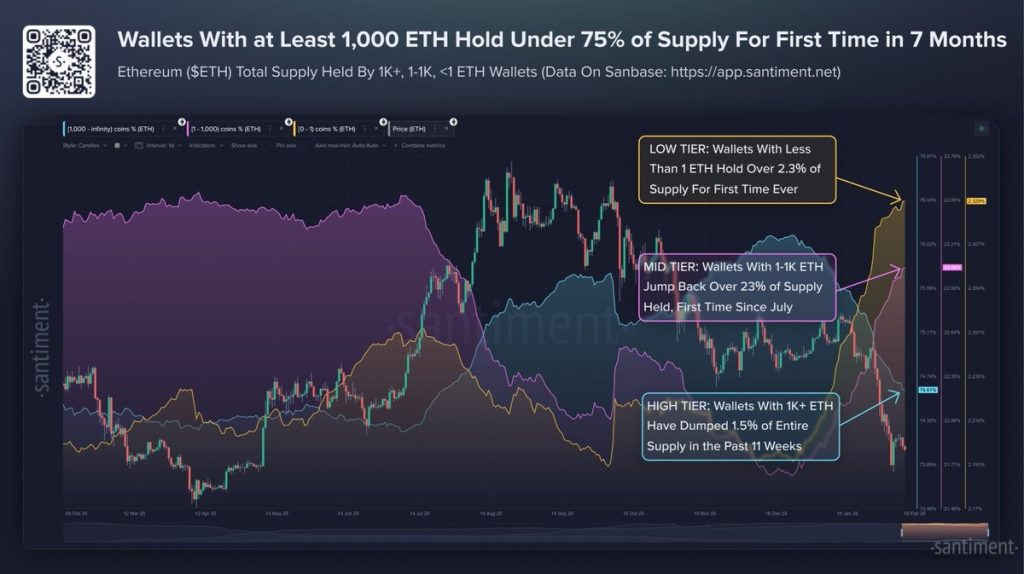
At the same time, mid-tier wallets (1–1K ETH) have stepped in, pushing their supply share back above 23% for the first time since July. Even more telling, small holders (<1 ETH) now control over 2.3% of supply for the first time, suggesting steady retail accumulation. From a trading perspective, this kind of top-down redistribution usually means reduced upside momentum in the short term.
$115 Million Leveraged Long Adds Liquidation Risk
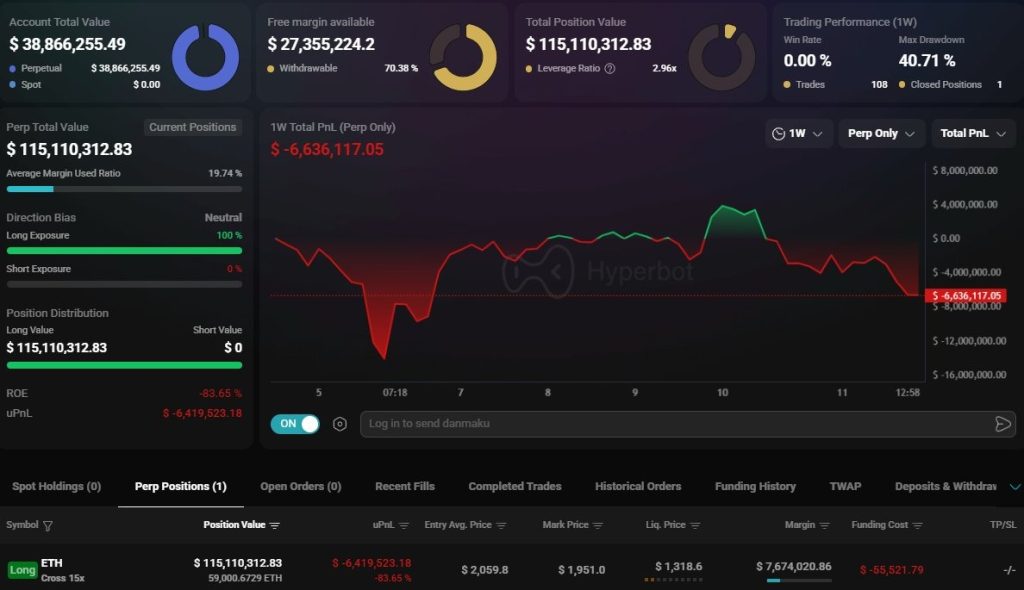
The data below shows that a whale has opened a $115 million Ethereum long position using 15x leverage, with the liquidation level sitting near $1,318. The account is fully long ETH with 100% long exposure and zero shorts, holding a massive $115M perpetual position at around $2,059 entry, while ETH is trading closer to $1,951. This is not spot accumulation. It is directional leverage.
 Source: X
The account is sitting on a weekly realized loss of ~$6.6M, with uPnL down ~$6.4M and ROE at -83.6%. The PnL curve shows brief relief rallies, but they fail to hold—classic signs of buying dips in a downtrend. Despite having $27M in free margin, the max drawdown of 40%+ signals poor timing rather than forced liquidation risk.
What This Suggests for Ethereum Price
Ethereum is currently in a high-conviction but high-risk zone.
- Accumulation addresses are buying below the cost basis.
- Staking activity continues to rise.
- Large wallets are partially redistributing supply.
- Leverage exposure is increasing.
This combination suggests structural confidence but fragile short-term conditions. However, the institutional conviction remains visible in staking activity. BitMine recently staked 140,400 ETH, bringing its total staked holdings to nearly 3 million ETH. Roughly 69% of its ETH exposure is now locked. Rising staking participation reduces the liquid supply in the market. Structurally, this supports long-term price stability.
Therefore, if spot demand puts pressure, the Ethereum (ETH) price could stabilise and build a base. If leverage unwinds first, volatility may expand before a clearer trend emerges. The next directional move will likely depend on whether accumulation outpaces speculative risk.
추천 콘텐츠

Unlock Opportunities with Coinbase Careers

Markets await Fed’s first 2025 cut, experts bet “this bull market is not even close to over”
