

Solana (SOL) Trades Heavy Below $90 As Breakdown Risk Grows
Solana failed to stay above $90 and corrected gains. SOL price is now trading below $85 and might find bids near the $76 zone.
- SOL price started a downside correction below $85 against the US Dollar.
- The price is now trading below $82 and the 100-hourly simple moving average.
- There is a bearish trend line forming with resistance at $81 on the hourly chart of the SOL/USD pair (data source from Kraken).
- The pair could extend losses if it dips below the $76 zone.
Solana Price Starts Downside Correction
Solana price failed to surpass $90 and started a downside correction, like Bitcoin and Ethereum. SOL dipped below $85 and $82 to enter a short-term bearish zone.
There was a move below the 50% Fib retracement level of the upward wave from the $67.40 swing low to the $89.72 high. Besides, there is a bearish trend line forming with resistance at $81 on the hourly chart of the SOL/USD pair.
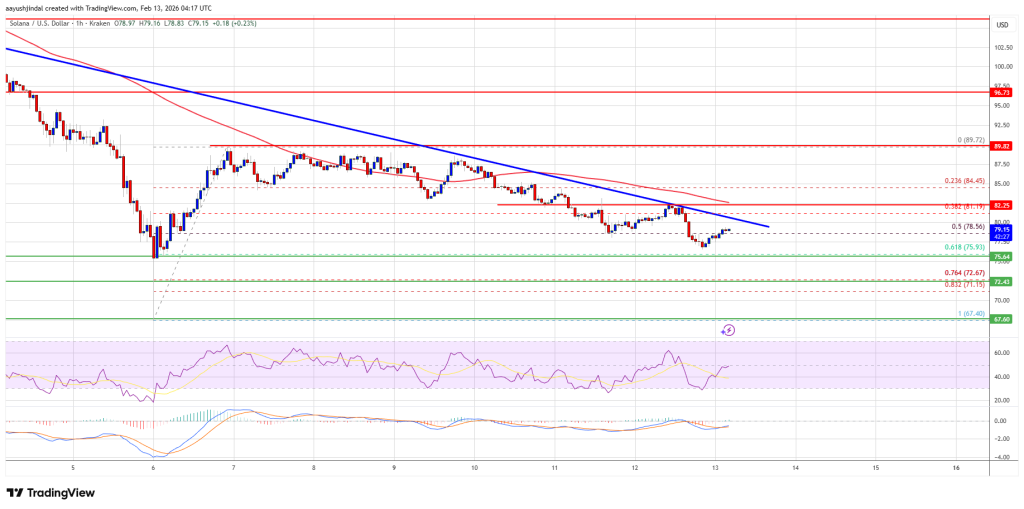
Solana is now trading below $80 and the 100-hourly simple moving average. On the upside, the price is facing resistance near the $81 level and the trend line. The next major resistance is near the $82.20 level. The main resistance could be $85. A successful close above the $85 resistance zone could set the pace for another steady increase. The next key resistance is $90. Any more gains might send the price toward the $102 level.
More Losses In SOL?
If SOL fails to rise above the $82 resistance, it could start another decline. Initial support on the downside is near the $76 zone and the 61.8% Fib retracement level of the upward wave from the $67.40 swing low to the $89.72 high. The first major support is near the $72.50 level.
A break below the $72.50 level might send the price toward the $68 support zone. If there is a close below the $68 support, the price could decline toward the $60 support in the near term.
Technical Indicators
Hourly MACD – The MACD for SOL/USD is gaining pace in the bearish zone.
Hourly Hours RSI (Relative Strength Index) – The RSI for SOL/USD is below the 50 level.
Major Support Levels – $76 and $72.50.
Major Resistance Levels – $81 and $85.
추천 콘텐츠

WuKong Chinese Ranked No.1 Globally Based on Cumulative Paying Users, According to Frost & Sullivan
What Happens If You Do Not Hire a Truck Accident Attorney
