Is the Bitcoin bull run over after BTC peaked at $124,200?
The ongoing Bitcoin bull run may be over, as it flashes numerous bearish chart patterns on the weekly chart.
- Bitcoin bull run could be ending as a risky pattern forms.
- It has formed a falling wedge pattern on the weekly chart.
- Demand for spot Bitcoin ETFs has waned in the past few days.
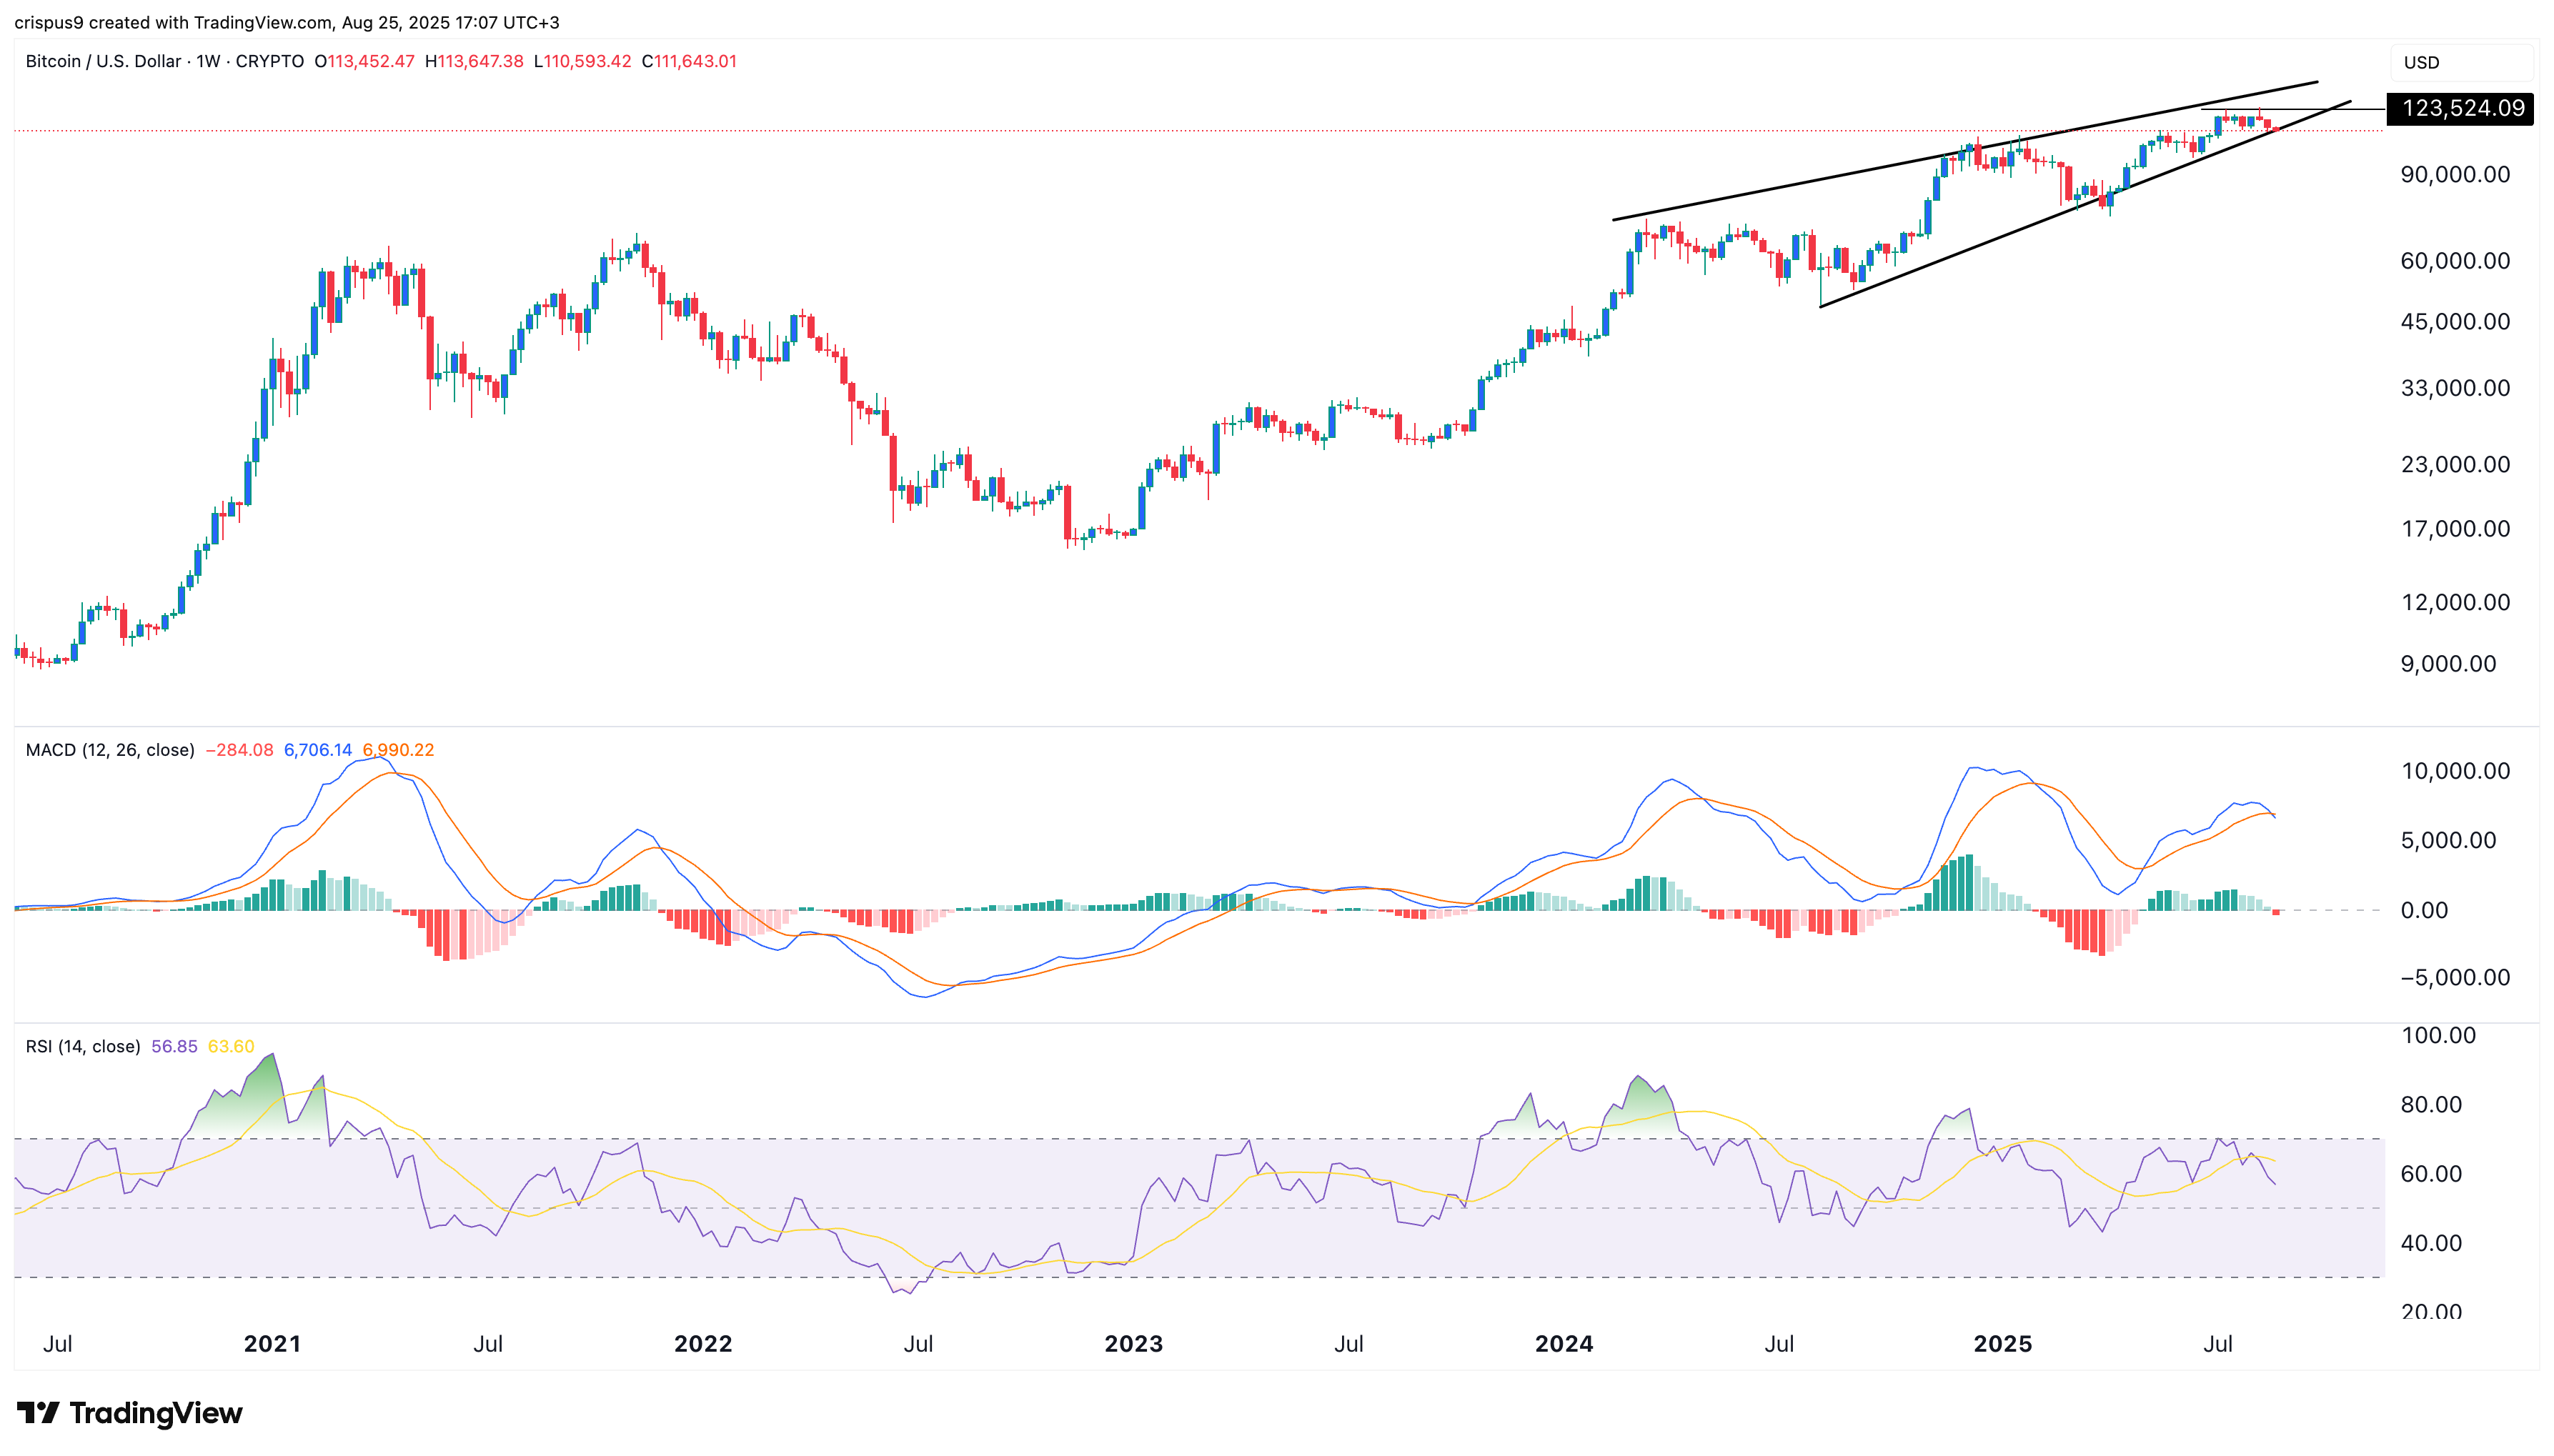
Bitcoin (BTC) price was trading at $112,835 today, down from its all-time high of $124,200. It has jumped by over 50% from its lowest level in April this year.
Weekly chart hints that the Bitcoin bull run may be over
The weekly chart below shows that the BTC price has been in a prolonged bull run in the past few years. It bottomed at $15,463 in late 2022 after the FTX implosion and then peaked at an all-time high of $124,200.
A closer look shows that the Bitcoin price has slowly formed the highly bearish rising wedge chart pattern on the weekly chart.
This pattern comprises two ascending and converging trendlines. The upper one connects the higher highs since March last year, while the lower one links the lower highs since August last year.
These two lines are nearing their convergence, which is where bearish breakouts happen.
Additionally, the Bitcoin price has formed a bearish divergence pattern, which happens when an asset is rising while the top oscillators are moving downwards.
In this case, the Percentage Price Oscillator, which is a modified MACD, has formed a series of lower highs and is nearing the zero line.
Similarly, the Relative Strength Index has moved from a high of 87.7 in February 2024 to 56 today. This divergence is shown in the descending trendline that connects the highest swings in February and November last year, and this month.
Meanwhile, the accumulation and distribution indicator has flattened, which is a sign that it has moved from the accumulation phase.
Therefore, the Bitcoin price will likely have a strong bearish breakdown in the coming days. Such a sell-off could see it drop to the 50-week moving average at $95,000.
Bitcoin ETF inflows are slowing
More data shows that Bitcoin ETF demand has waned in the past few weeks, a sign that institutional investors are not buying as aggressively as they did in the past.
SoSoValue data shows that spot Bitcoin ETFs had over $1.17 billion in outflows last week, much higher than the $547 million inflows they had in the previous week.
More data from CoinGlass shows that the amount of Bitcoin held on exchanges has started ticking up in the past few days. There are now 2.25 million coins, the highest level since Aug. 7. Rising exchange balances are a sign that investors are selling their coins.


추천 콘텐츠

XRP price risks drop to $1.10 as supply in profit drops to 17-month lows

XAG/USD drifts below $72 with all eyes on Iran’s war