

A prominent market analyst insists Ethereum still has more room to grow, calling attention to a confluence factor that could trigger the next leg up. Notably, Ethereum finds itself at a decisive point after reaching a new all-time high of $4,955 in August. Since then, the price has dropped 13%, but it continues to hold above $4,300 despite doubts about whether the bull run still has legs. Ethereum Still Has More Upside Potential Interestingly, market analyst EGRAG Crypto believes the rally has not ended. In his latest analysis, he argued that Ethereum could still climb much higher, even reaching $22,000, if it breaks out of a long-term ascending triangle pattern that has dictated price action for more than two years. For context, EGRAG's analysis looks at Ethereum's entire price history and focuses on important Fibonacci levels across three major cycles. In one accompanying chart, the analyst tracks how each cycle ended at specific Fibonacci extensions he calls "HITs." Ethereum Fib Hits | EGRAG Crypto Specifically, during the first major rally from 2015 to January 2018, Ethereum topped out above the 3.888 Fibonacci extension ($1,285) when it reached a peak of $1,420. This marked the top of Cycle One. Meanwhile, the second big run between 2018 and 2021 ended above the 1.414 Fibonacci extension ($4,266), with Ethereum soaring to a high of $4,868 by November 2021. This price set the Cycle Two high before the bear market hit. During the bear market, the 2022 crash dragged Ethereum to a low near $880, which started Cycle Three. From there, the price built a recovery path through several Fibonacci retracement levels: $2,052 at the 0.5 level, $2,882 at 0.702, and $3,942 at 0.888. The Confluence Factor: ETH Needs to Break the Ascending Triangle Notably, the 1.0 extension at $4,760 now acts as the major horizontal resistance line and the top boundary of the ascending triangle. With its price now at $4,378, Ethereum trades just below this level, holding steady after reclaiming those key retracement zones one by one. Meanwhile, another EGRAG chart focused on the ascending triangle, which stretches from the 2022 low through higher lows in 2023, 2024, and 2025. The top of the triangle sits at $4,760. This forms the breakout point EGRAG calls the confluence factor. Ethereum Ascending Triangle | EGRAG Crypto He explained that a breakout above this line would trigger three possible price targets based on different measurement methods. Specifically, a non-logarithmic projection points to $8,500, which lines up near the 1.272 Fibonacci extension at $7,522 and stays below the 1.414 level at $9,553. The average between logarithmic and non-logarithmic methods sets a midpoint target of $15,250, landing between the 1.414 and 1.618 extensions. However, the most aggressive target comes from the logarithmic method, which projects $22,000, aligning with VanEck's predictions. This would push Ethereum far above the 1.618 Fibonacci extension at $13,465, repeating the kind of late-cycle overshoot from earlier rallies. EGRAG noted that every past cycle has topped at one of these extension levels. For context, Cycle One ended at 3.888, while Cycle Two stopped at 1.414. For the current cycle, the key levels stand at 1.272, 1.414, and 1.618, with the $4,760 breakout level serving as the trigger for the next big move. Other Analysts Agree Interestingly, other analysts also believe Ethereum still has more growth potential this cycle. In an analysis today, veteran trader Michaël van de Poppe compared Ethereum's current setup to late 2019 or early 2020 in the previous cycle. Ethereum Against Bitcoin | Michael van de Poppe He pointed out that Ethereum recently broke above its 20-week exponential moving average after the longest bear market in its history, signaling the start of a lasting uptrend rather than a quick pump. Meanwhile, Web3 commentator Zyn also highlighted that Ethereum ended a four-year downtrend, set a new all-time high, and now retests the breakout level as support. He believes this kind of setup often leads to another major rally. https://twitter.com/Zynweb3/status/1962811739638243476A prominent market analyst insists Ethereum still has more room to grow, calling attention to a confluence factor that could trigger the next leg up. Notably, Ethereum finds itself at a decisive point after reaching a new all-time high of $4,955 in August. Since then, the price has dropped 13%, but it continues to hold above $4,300 despite doubts about whether the bull run still has legs. Ethereum Still Has More Upside Potential Interestingly, market analyst EGRAG Crypto believes the rally has not ended. In his latest analysis, he argued that Ethereum could still climb much higher, even reaching $22,000, if it breaks out of a long-term ascending triangle pattern that has dictated price action for more than two years. For context, EGRAG's analysis looks at Ethereum's entire price history and focuses on important Fibonacci levels across three major cycles. In one accompanying chart, the analyst tracks how each cycle ended at specific Fibonacci extensions he calls "HITs." Ethereum Fib Hits | EGRAG Crypto Specifically, during the first major rally from 2015 to January 2018, Ethereum topped out above the 3.888 Fibonacci extension ($1,285) when it reached a peak of $1,420. This marked the top of Cycle One. Meanwhile, the second big run between 2018 and 2021 ended above the 1.414 Fibonacci extension ($4,266), with Ethereum soaring to a high of $4,868 by November 2021. This price set the Cycle Two high before the bear market hit. During the bear market, the 2022 crash dragged Ethereum to a low near $880, which started Cycle Three. From there, the price built a recovery path through several Fibonacci retracement levels: $2,052 at the 0.5 level, $2,882 at 0.702, and $3,942 at 0.888. The Confluence Factor: ETH Needs to Break the Ascending Triangle Notably, the 1.0 extension at $4,760 now acts as the major horizontal resistance line and the top boundary of the ascending triangle. With its price now at $4,378, Ethereum trades just below this level, holding steady after reclaiming those key retracement zones one by one. Meanwhile, another EGRAG chart focused on the ascending triangle, which stretches from the 2022 low through higher lows in 2023, 2024, and 2025. The top of the triangle sits at $4,760. This forms the breakout point EGRAG calls the confluence factor. Ethereum Ascending Triangle | EGRAG Crypto He explained that a breakout above this line would trigger three possible price targets based on different measurement methods. Specifically, a non-logarithmic projection points to $8,500, which lines up near the 1.272 Fibonacci extension at $7,522 and stays below the 1.414 level at $9,553. The average between logarithmic and non-logarithmic methods sets a midpoint target of $15,250, landing between the 1.414 and 1.618 extensions. However, the most aggressive target comes from the logarithmic method, which projects $22,000, aligning with VanEck's predictions. This would push Ethereum far above the 1.618 Fibonacci extension at $13,465, repeating the kind of late-cycle overshoot from earlier rallies. EGRAG noted that every past cycle has topped at one of these extension levels. For context, Cycle One ended at 3.888, while Cycle Two stopped at 1.414. For the current cycle, the key levels stand at 1.272, 1.414, and 1.618, with the $4,760 breakout level serving as the trigger for the next big move. Other Analysts Agree Interestingly, other analysts also believe Ethereum still has more growth potential this cycle. In an analysis today, veteran trader Michaël van de Poppe compared Ethereum's current setup to late 2019 or early 2020 in the previous cycle. Ethereum Against Bitcoin | Michael van de Poppe He pointed out that Ethereum recently broke above its 20-week exponential moving average after the longest bear market in its history, signaling the start of a lasting uptrend rather than a quick pump. Meanwhile, Web3 commentator Zyn also highlighted that Ethereum ended a four-year downtrend, set a new all-time high, and now retests the breakout level as support. He believes this kind of setup often leads to another major rally. https://twitter.com/Zynweb3/status/1962811739638243476
Analyst Expects Ethereum to Target $22,000 Once This Confluence Factor Falls Into Place
이 콘텐츠에 대한 의견이나 우려 사항이 있으시면 crypto.news@mexc.com으로 연락주시기 바랍니다
A prominent market analyst insists Ethereum still has more room to grow, calling attention to a confluence factor that could trigger the next leg up. Notably, Ethereum finds itself at a decisive point after reaching a new all-time high of $4,955 in August. Since then, the price has dropped 13%, but it continues to hold above $4,300 despite doubts about whether the bull run still has legs. Ethereum Still Has More Upside Potential Interestingly, market analyst EGRAG Crypto believes the rally has not ended. In his latest analysis, he argued that Ethereum could still climb much higher, even reaching $22,000, if it breaks out of a long-term ascending triangle pattern that has dictated price action for more than two years. For context, EGRAG's analysis looks at Ethereum's entire price history and focuses on important Fibonacci levels across three major cycles. In one accompanying chart, the analyst tracks how each cycle ended at specific Fibonacci extensions he calls "HITs." 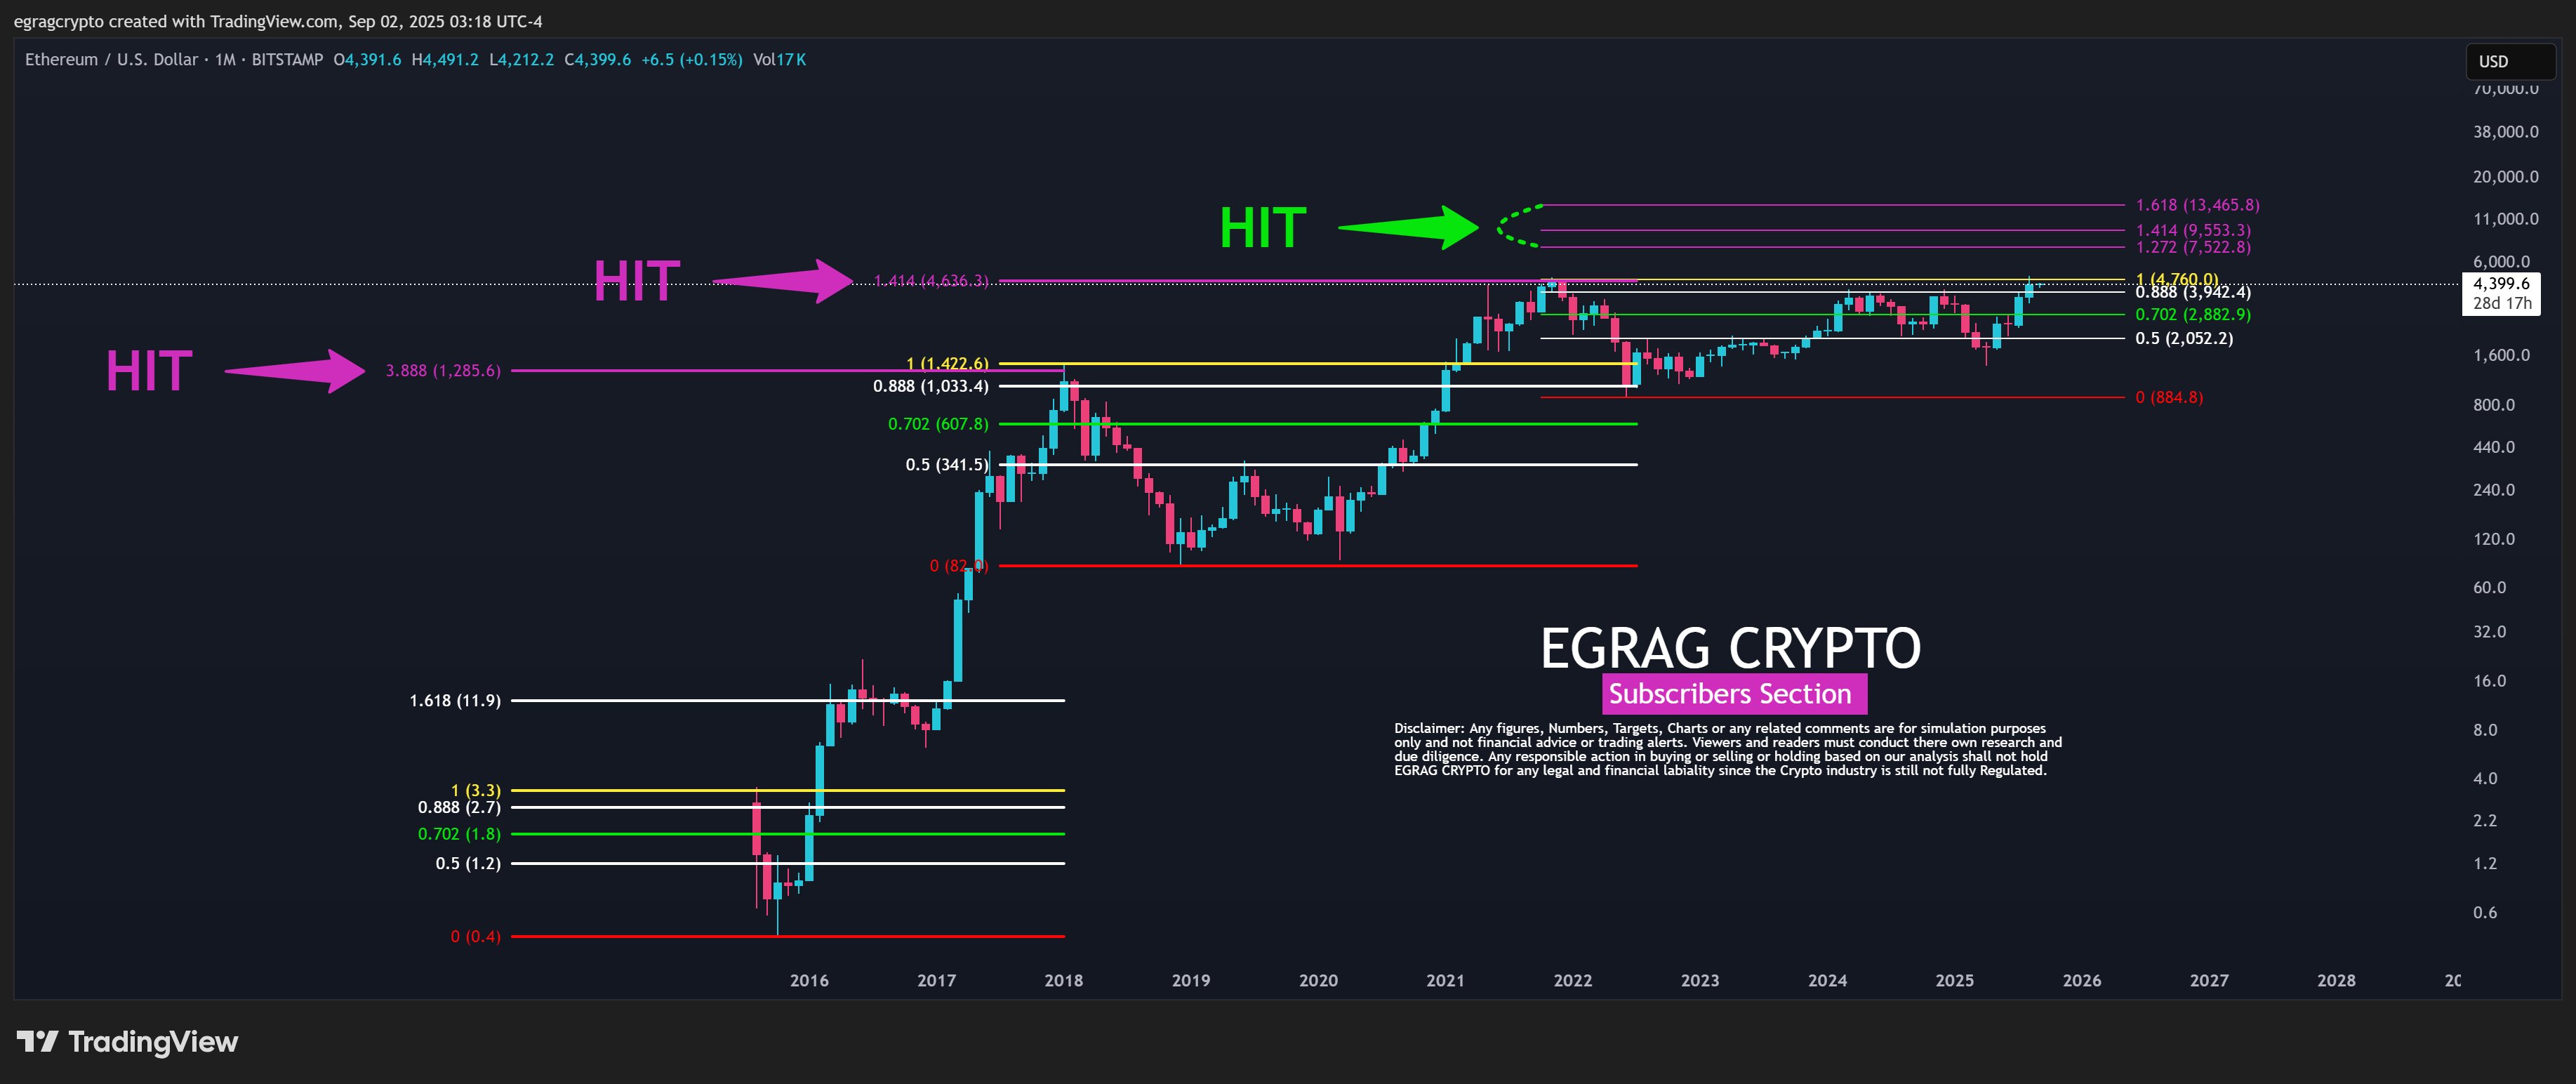 Ethereum Fib Hits | EGRAG Crypto Specifically, during the first major rally from 2015 to January 2018, Ethereum topped out above the 3.888 Fibonacci extension ($1,285) when it reached a peak of $1,420. This marked the top of Cycle One. Meanwhile, the second big run between 2018 and 2021 ended above the 1.414 Fibonacci extension ($4,266), with Ethereum soaring to a high of $4,868 by November 2021. This price set the Cycle Two high before the bear market hit. During the bear market, the 2022 crash dragged Ethereum to a low near $880, which started Cycle Three. From there, the price built a recovery path through several Fibonacci retracement levels: $2,052 at the 0.5 level, $2,882 at 0.702, and $3,942 at 0.888. The Confluence Factor: ETH Needs to Break the Ascending Triangle Notably, the 1.0 extension at $4,760 now acts as the major horizontal resistance line and the top boundary of the ascending triangle. With its price now at $4,378, Ethereum trades just below this level, holding steady after reclaiming those key retracement zones one by one. Meanwhile, another EGRAG chart focused on the ascending triangle, which stretches from the 2022 low through higher lows in 2023, 2024, and 2025. The top of the triangle sits at $4,760. This forms the breakout point EGRAG calls the confluence factor.
 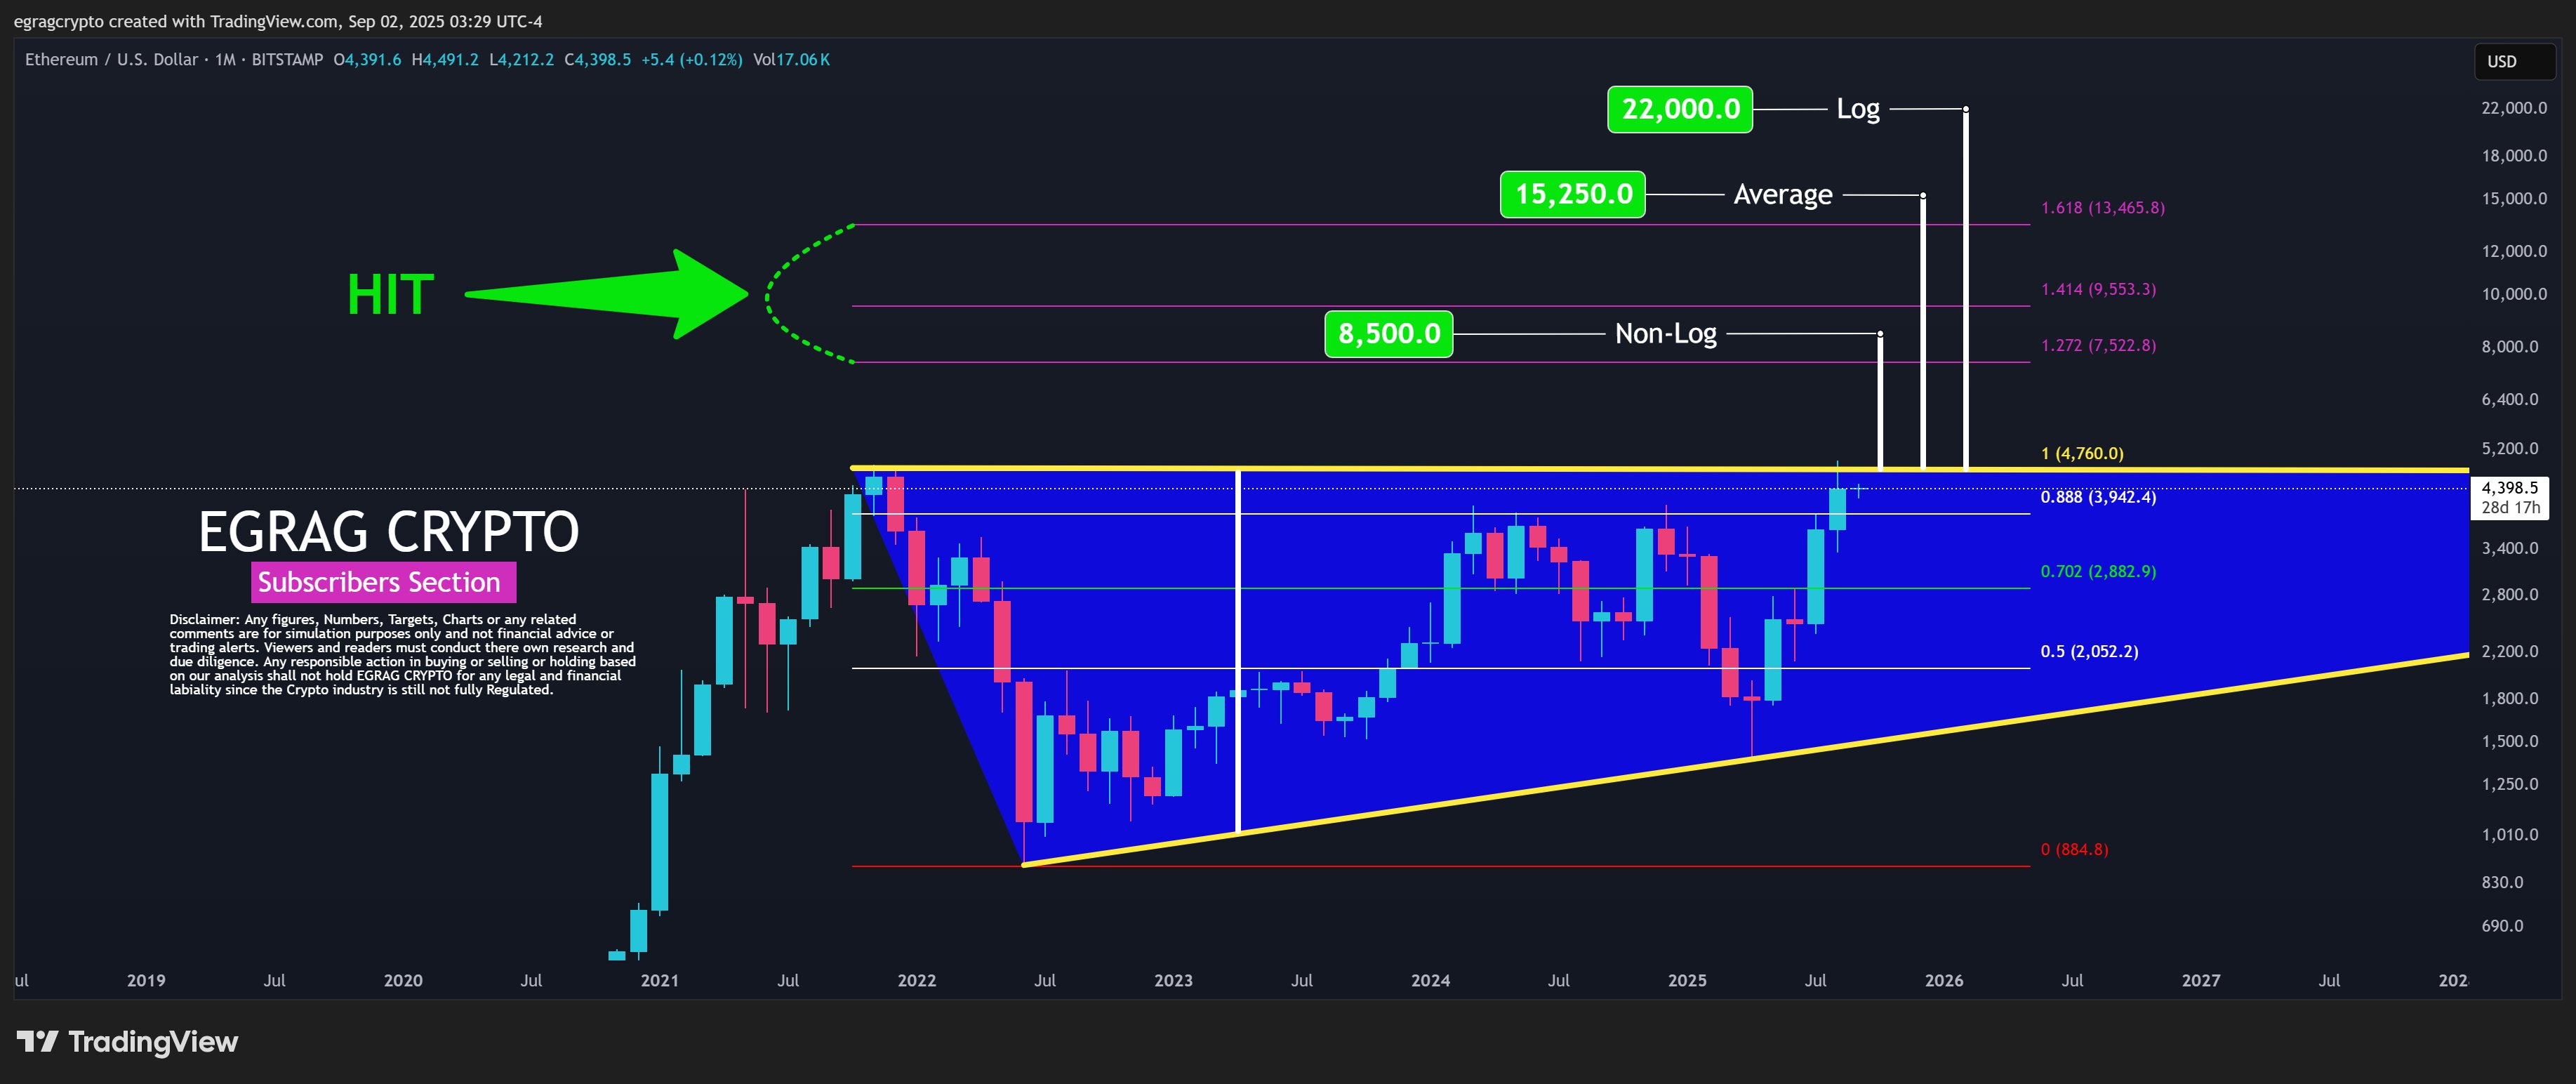 Ethereum Ascending Triangle | EGRAG Crypto He explained that a breakout above this line would trigger three possible price targets based on different measurement methods. Specifically, a non-logarithmic projection points to $8,500, which lines up near the 1.272 Fibonacci extension at $7,522 and stays below the 1.414 level at $9,553. The average between logarithmic and non-logarithmic methods sets a midpoint target of $15,250, landing between the 1.414 and 1.618 extensions. However, the most aggressive target comes from the logarithmic method, which projects $22,000, aligning with VanEck's predictions. This would push Ethereum far above the 1.618 Fibonacci extension at $13,465, repeating the kind of late-cycle overshoot from earlier rallies. EGRAG noted that every past cycle has topped at one of these extension levels. For context, Cycle One ended at 3.888, while Cycle Two stopped at 1.414. For the current cycle, the key levels stand at 1.272, 1.414, and 1.618, with the $4,760 breakout level serving as the trigger for the next big move. Other Analysts Agree Interestingly, other analysts also believe Ethereum still has more growth potential this cycle. In an analysis today, veteran trader Michaël van de Poppe compared Ethereum's current setup to late 2019 or early 2020 in the previous cycle.
 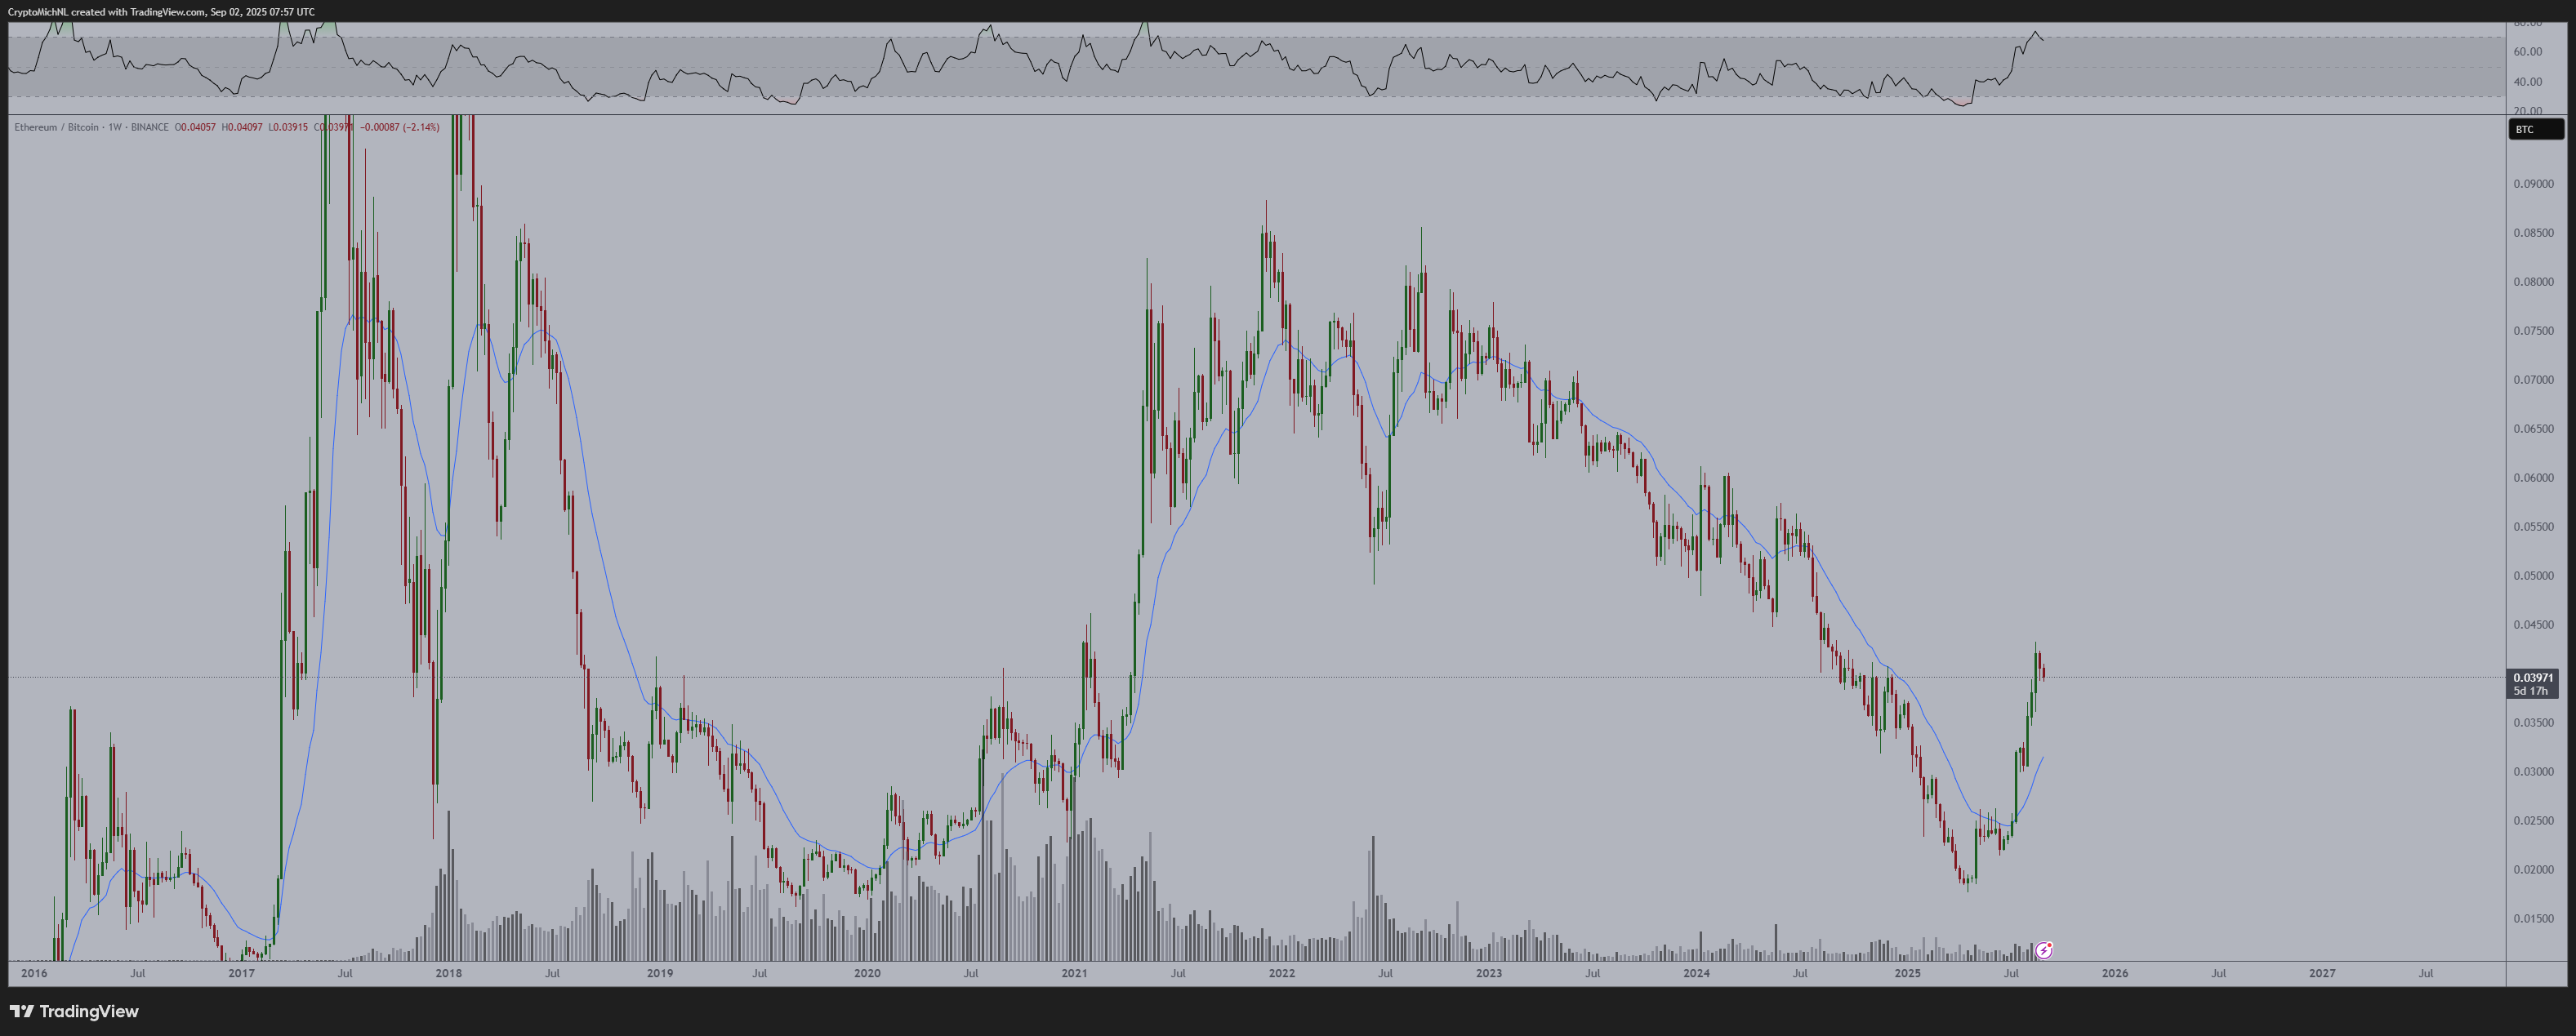 Ethereum Against Bitcoin | Michael van de Poppe He pointed out that Ethereum recently broke above its 20-week exponential moving average after the longest bear market in its history, signaling the start of a lasting uptrend rather than a quick pump. Meanwhile, Web3 commentator Zyn also highlighted that Ethereum ended a four-year downtrend, set a new all-time high, and now retests the breakout level as support. He believes this kind of setup often leads to another major rally. https://twitter.com/Zynweb3/status/1962811739638243476
Ethereum Fib Hits | EGRAG Crypto Specifically, during the first major rally from 2015 to January 2018, Ethereum topped out above the 3.888 Fibonacci extension ($1,285) when it reached a peak of $1,420. This marked the top of Cycle One. Meanwhile, the second big run between 2018 and 2021 ended above the 1.414 Fibonacci extension ($4,266), with Ethereum soaring to a high of $4,868 by November 2021. This price set the Cycle Two high before the bear market hit. During the bear market, the 2022 crash dragged Ethereum to a low near $880, which started Cycle Three. From there, the price built a recovery path through several Fibonacci retracement levels: $2,052 at the 0.5 level, $2,882 at 0.702, and $3,942 at 0.888. The Confluence Factor: ETH Needs to Break the Ascending Triangle Notably, the 1.0 extension at $4,760 now acts as the major horizontal resistance line and the top boundary of the ascending triangle. With its price now at $4,378, Ethereum trades just below this level, holding steady after reclaiming those key retracement zones one by one. Meanwhile, another EGRAG chart focused on the ascending triangle, which stretches from the 2022 low through higher lows in 2023, 2024, and 2025. The top of the triangle sits at $4,760. This forms the breakout point EGRAG calls the confluence factor. Ethereum Ascending Triangle | EGRAG Crypto He explained that a breakout above this line would trigger three possible price targets based on different measurement methods. Specifically, a non-logarithmic projection points to $8,500, which lines up near the 1.272 Fibonacci extension at $7,522 and stays below the 1.414 level at $9,553. The average between logarithmic and non-logarithmic methods sets a midpoint target of $15,250, landing between the 1.414 and 1.618 extensions. However, the most aggressive target comes from the logarithmic method, which projects $22,000, aligning with VanEck's predictions. This would push Ethereum far above the 1.618 Fibonacci extension at $13,465, repeating the kind of late-cycle overshoot from earlier rallies. EGRAG noted that every past cycle has topped at one of these extension levels. For context, Cycle One ended at 3.888, while Cycle Two stopped at 1.414. For the current cycle, the key levels stand at 1.272, 1.414, and 1.618, with the $4,760 breakout level serving as the trigger for the next big move. Other Analysts Agree Interestingly, other analysts also believe Ethereum still has more growth potential this cycle. In an analysis today, veteran trader Michaël van de Poppe compared Ethereum's current setup to late 2019 or early 2020 in the previous cycle. Ethereum Against Bitcoin | Michael van de Poppe He pointed out that Ethereum recently broke above its 20-week exponential moving average after the longest bear market in its history, signaling the start of a lasting uptrend rather than a quick pump. Meanwhile, Web3 commentator Zyn also highlighted that Ethereum ended a four-year downtrend, set a new all-time high, and now retests the breakout level as support. He believes this kind of setup often leads to another major rally. https://twitter.com/Zynweb3/status/1962811739638243476시장 기회
니어 가격(NEAR)
$1.3281
$1.3281$1.3281
USD
니어 (NEAR) 실시간 가격 차트


면책 조항: 본 사이트에 재게시된 글들은 공개 플랫폼에서 가져온 것으로 정보 제공 목적으로만 제공됩니다. 이는 반드시 MEXC의 견해를 반영하는 것은 아닙니다. 모든 권리는 원저자에게 있습니다. 제3자의 권리를 침해하는 콘텐츠가 있다고 판단될 경우, crypto.news@mexc.com으로 연락하여 삭제 요청을 해주시기 바랍니다. MEXC는 콘텐츠의 정확성, 완전성 또는 시의적절성에 대해 어떠한 보증도 하지 않으며, 제공된 정보에 기반하여 취해진 어떠한 조치에 대해서도 책임을 지지 않습니다. 본 콘텐츠는 금융, 법률 또는 기타 전문적인 조언을 구성하지 않으며, MEXC의 추천이나 보증으로 간주되어서는 안 됩니다.
추천 콘텐츠

Your guide to Disney Adventure’s 7 themed areas
You can experience the magic of Disney's storytelling at a large scale (while at sea!) in the Disney Adventure's seven themed areas!
공유하기
Rappler2026/04/09 20:27

This startup is building an ‘intelligence layer’ for Nigeria’s power grid
PowerLabs wants to make sense of Nigeria’s crowded power mix. Its premise is simple: that the country’s energy problem is no longer just about supply, but about
공유하기
Techcabal2026/04/09 19:56
Republicans shrug as 'socialist' Trump accusations fly
WASHINGTON — President Donald Trump has overseen an unprecedented melding of the private sector with the federal government — so much so that critics say it smells
공유하기
Rawstory2026/04/09 19:58


