

Safe Haven Split: Bitcoin-Gold Correlation Turns Negative For First Time In 6 Months
Data shows the correlation between Bitcoin and Gold has turned negative, a sign that the two assets are moving in the direction opposite to each other.
Correlation Coefficient Is Now Underwater For Bitcoin & Gold
In a new post on X, CryptoQuant community analyst Maartunn has talked about the latest trend in the Correlation Coefficient between Bitcoin and Gold. The Correlation Coefficient is a tool from statistics that measures the relationship between two given variables over a given period, typically one month. In the current case, the variables are the prices of BTC and Gold.
When the value of the metric is positive, it means the price of one asset is reacting to movements in the other by traveling in the same direction. The closer is the indicator to 1, the stronger is this relationship.
On the other hand, the coefficient being under zero implies there exists a negative correlation between the two assets. That is, they are moving opposite to each other. The extreme point for this side lies at -1.
There also exists a third case for the Correlation Coefficient: a level exactly equal to zero. Such a value indicates no correlation whatsoever exists between the assets. In other words, their prices are independent of each other.
Now, here is the chart shared by Maartunn that shows the trend in the Bitcoin Coefficient Correlation for Bitcoin and Gold over the past year:
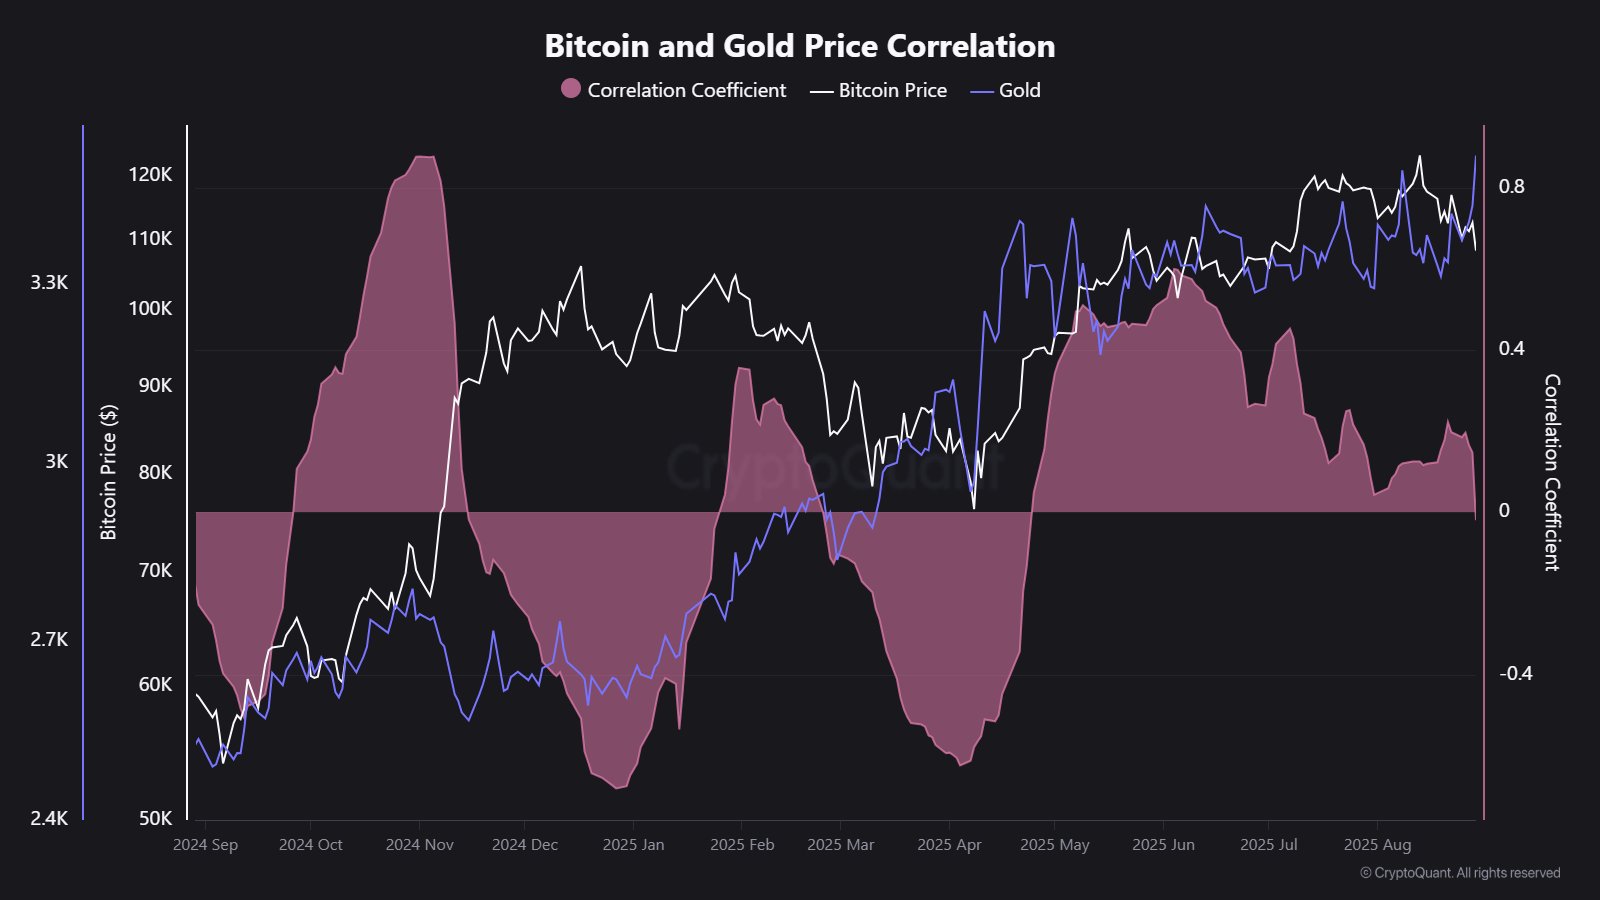
As displayed in the above graph, the Correlation Coefficient between Bitcoin and Gold shot up to a high above 0.5 back in June, suggesting the assets’ prices were tied to some degree.
Following this peak, however, the correlation between the assets began to weaken, with the metric’s value slipping down. For a while it maintained inside the positive territory, but recently, that has changed.
Gold has seen a price rally while BTC has been facing bearish action, resulting in the Correlation Coefficient turning slightly negative. This is the first time since February that the indicator has gone underwater.
For now, the two assets are almost independent, but it remains to be seen whether the negative correlation will continue to grow in the coming days. Gold is the traditional safe-haven asset, while Bitcoin is associated as its digital counterpart. Periods where the two assets diverge can challenge the narrative for BTC.
BTC Price
At the time of writing, Bitcoin is trading around $110,100, down almost 2% over the past week.


추천 콘텐츠

$45 Million in Crypto Fraud Mapped as Operation Atlantic Identifies Victims Across US, UK, Canada – Bitcoin News

NZD/USD holds losses near 0.5850 on mixed Chinese data, US CPI looms


