
What Is the Long/Short Ratio? How to View Long/Short Ratio Data in Futures Trading?
1. What Is the Long/Short Ratio?
2. What Are the Benefits of Understanding the Long/Short Ratio?
- Gauge market sentiment: Quickly identify whether the market is leaning bullish or bearish, helping to avoid blindly following trends.
- Support trading decisions: When combined with candlestick patterns and trading volume, the ratio can help confirm buy or sell signals.
- Risk management: In periods of extreme sentiment, it helps identify potential reversal risks and reduce the likelihood of being trapped in adverse positions.
- Strategy optimization: Whether trading short-term or long-term, the long/short ratio serves as a valuable reference indicator to improve the consistency and reliability of trading strategies.
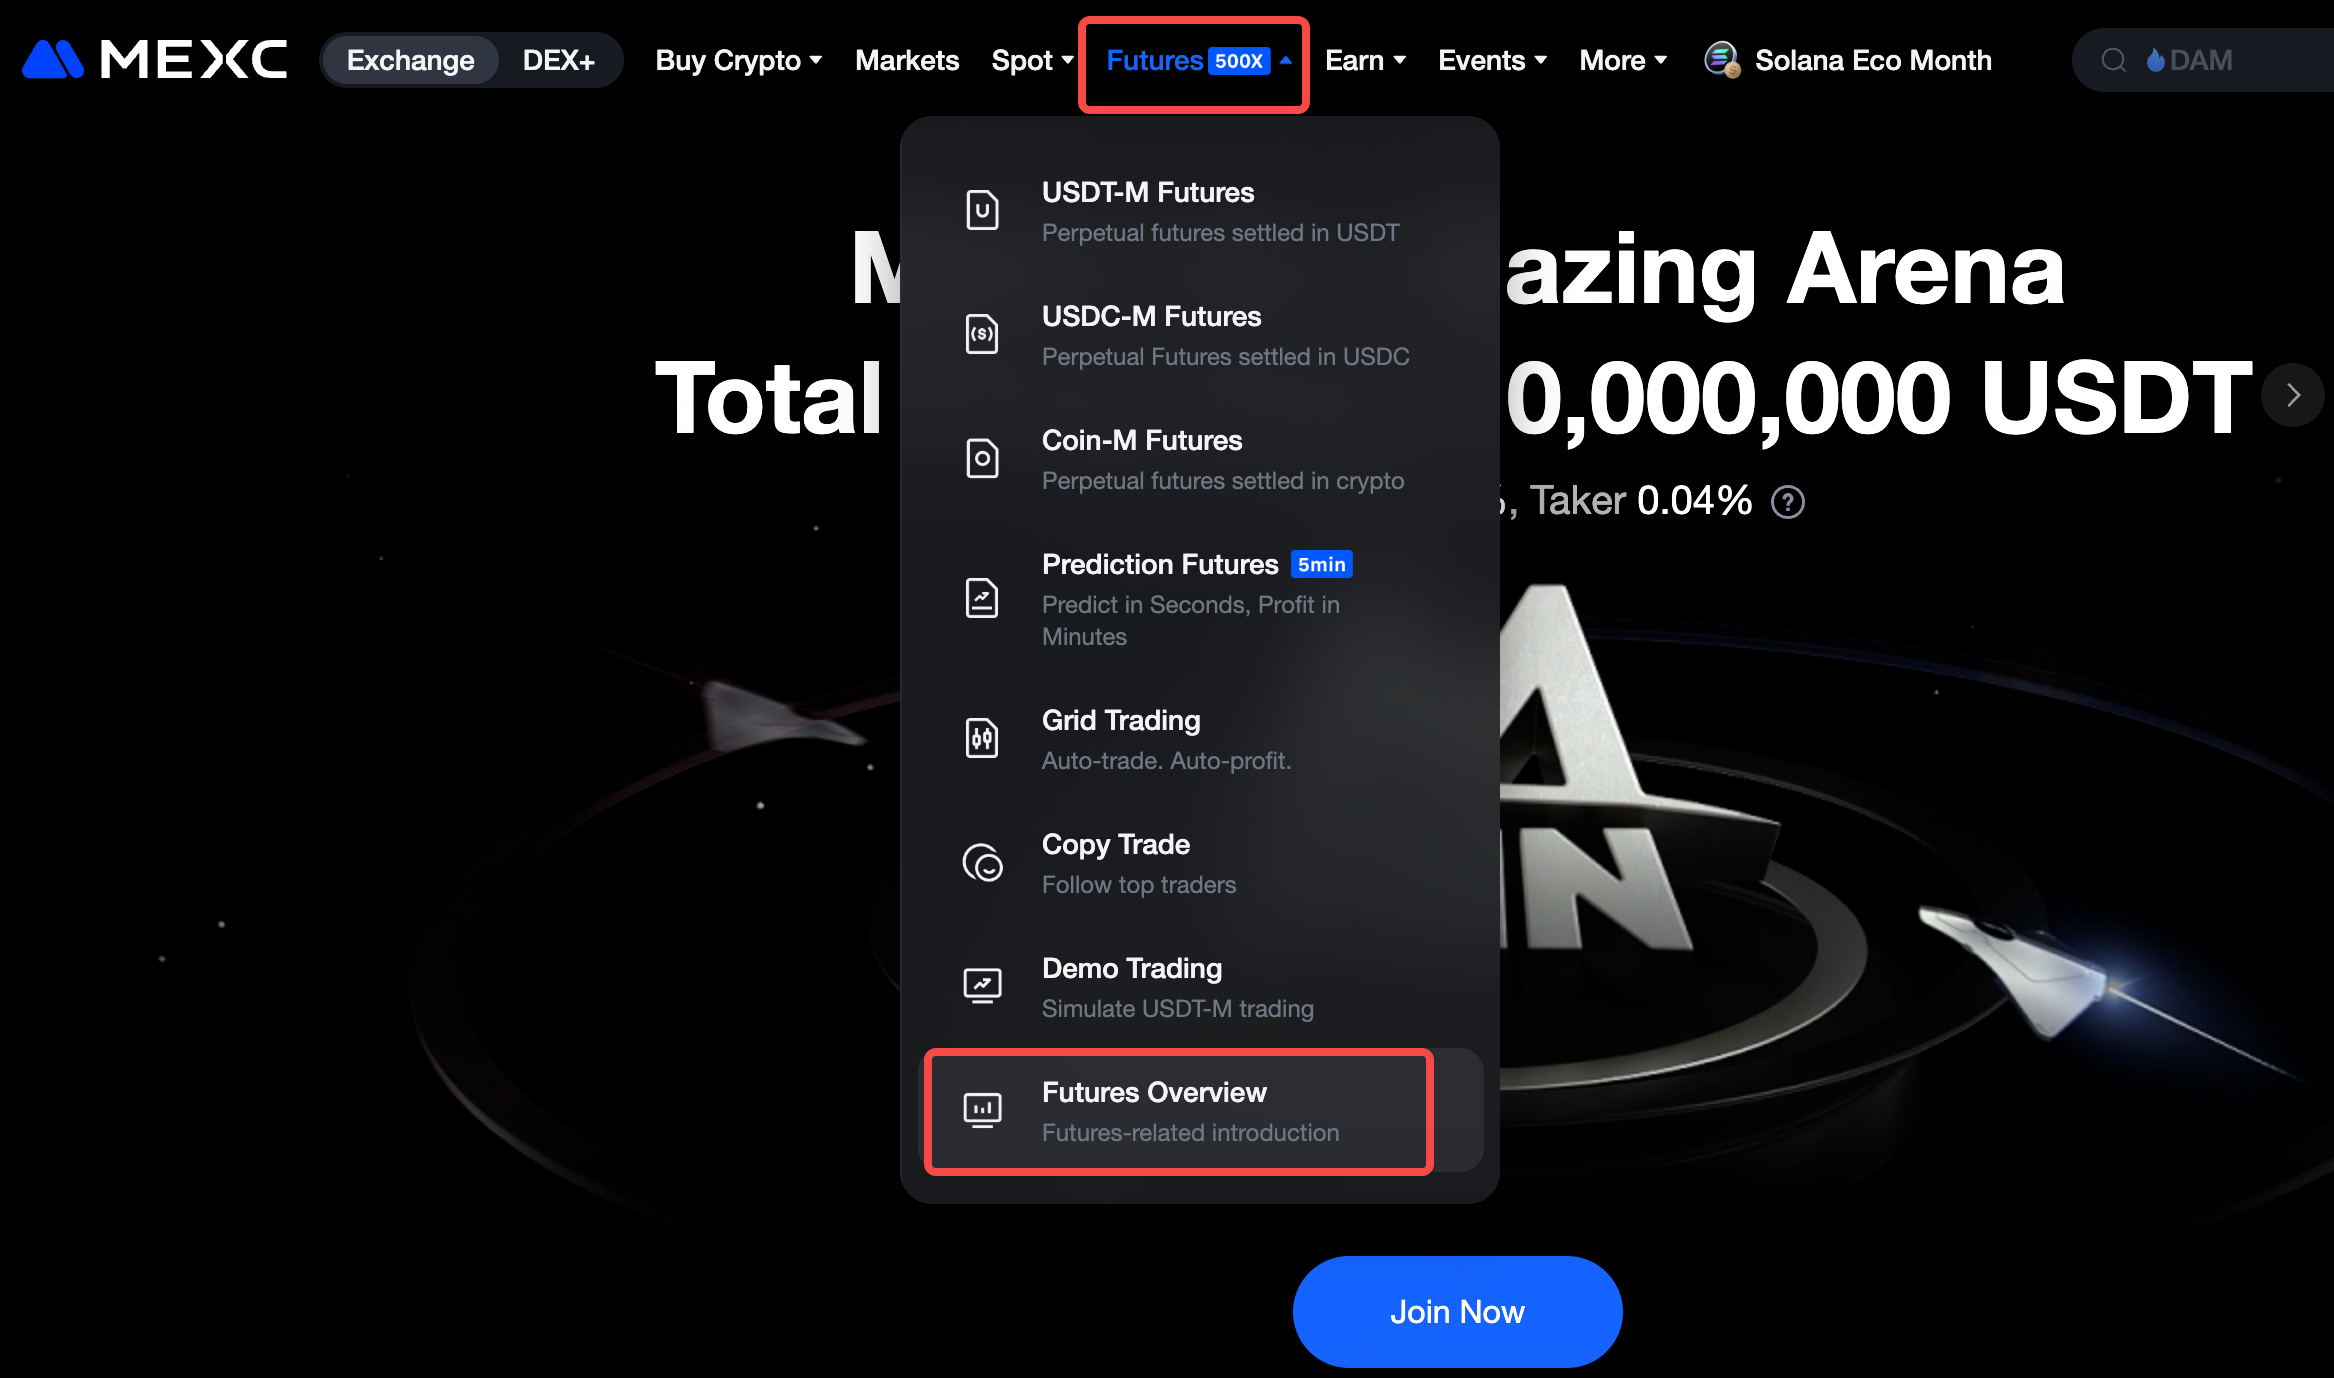
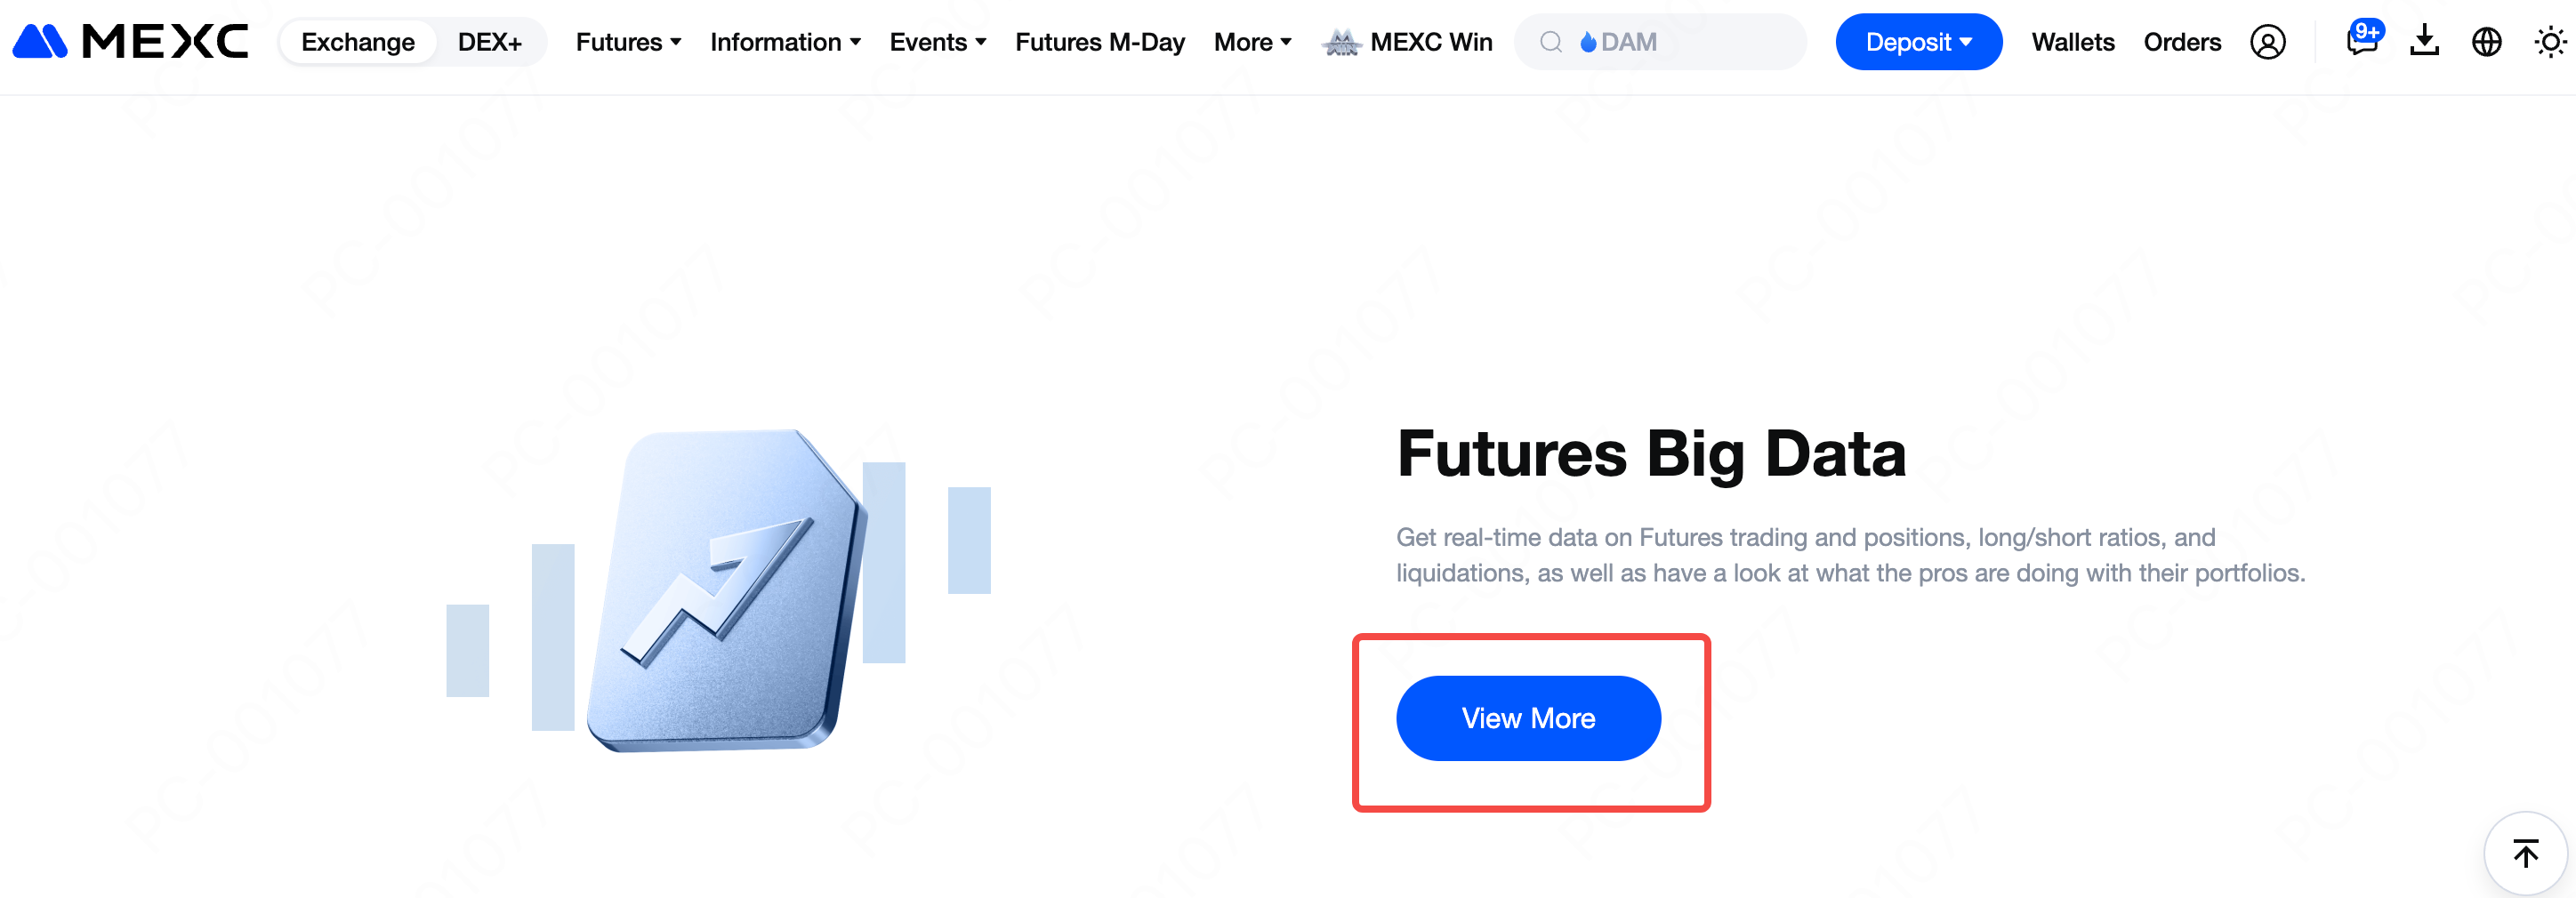
3. How to View Long/Short Ratio Data on MEXC Futures?
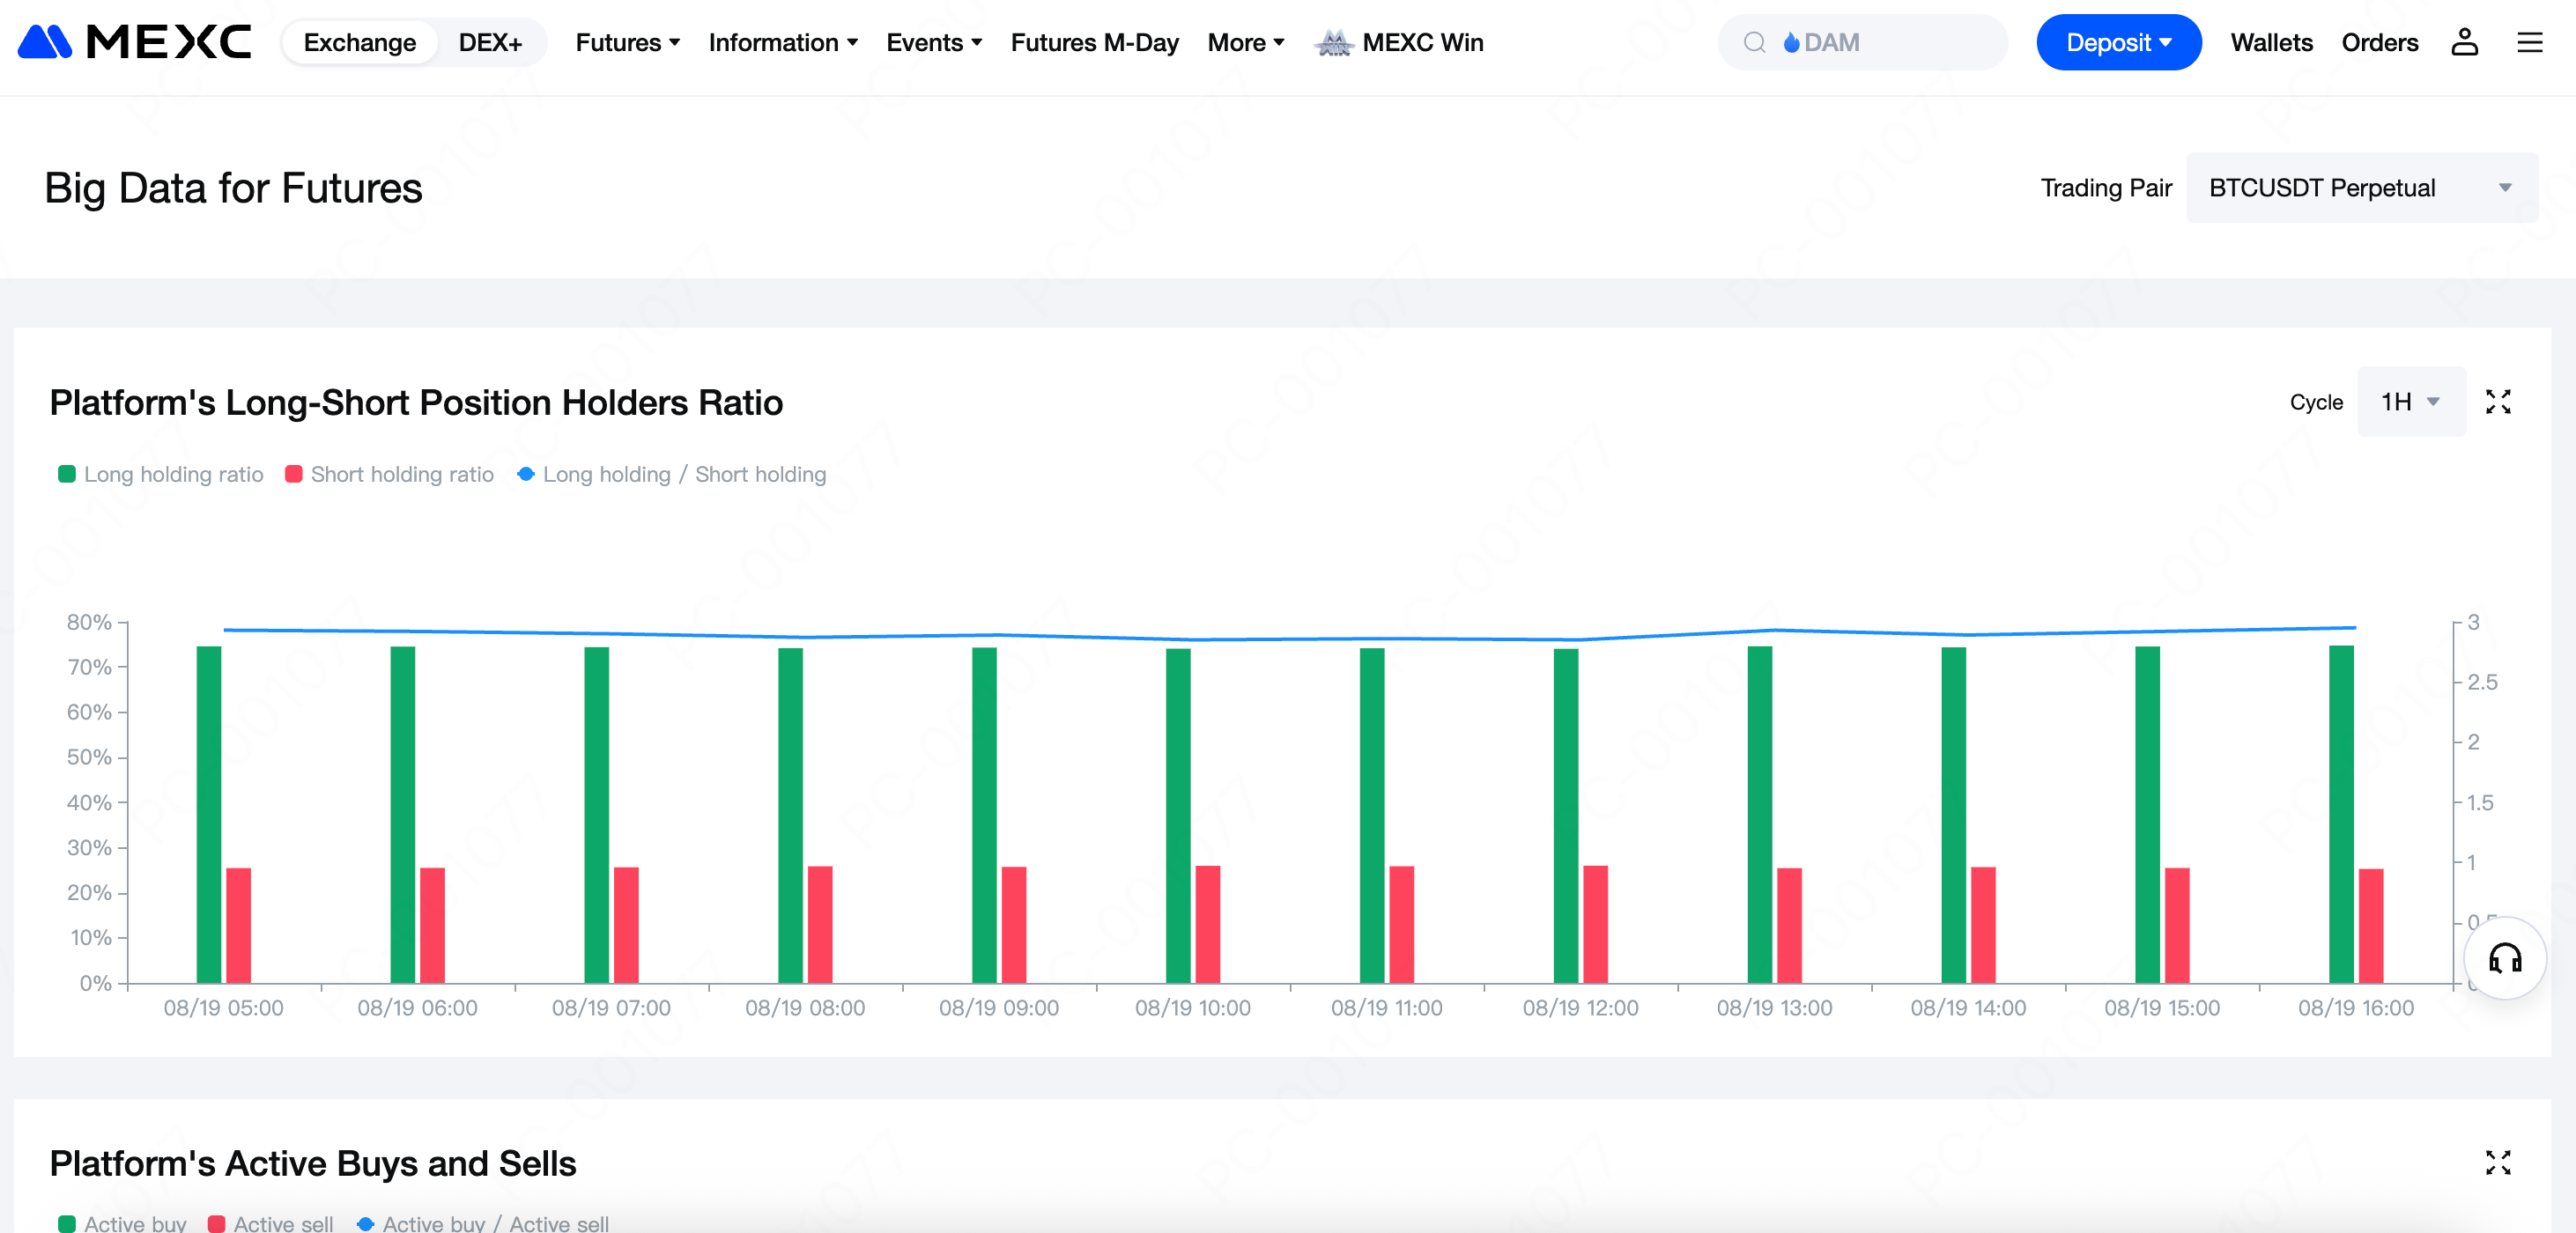
4. Core Features of MEXC Long/Short Ratio Data
5. How to Use MEXC Long/Short Data
5.1 Buy Signal
5.2 Sell Signal
5.3 Trend Confirmation
5.4 Divergence Signal
Recommended Reading:
- Why Choose MEXC Futures? Gain deeper insight into the advantages and unique features of MEXC Futures to help you stay ahead in the market.
- How to Participate in M-Day Learn the step-by-step methods and tips for joining M-Day and don't miss out on over 80,000 USDT in daily Futures bonus airdrops.
- MEXC Futures Trading Tutorial (App) Understand the full process of trading Futures on the app and get started with ease.
Popüler Makaleler

How to Verify My Residential Address on MEXC
Providing proof of address (POA) is part of MEXC's KYC verification process. After registering a MEXC account, you must upload a POA document to complete identity verification and ensure compliance wi

Dogecoin All-Time High: When It Happened and What Drove the Surge
Key TakeawaysDogecoin’s all-time high (ATH) occurred on May 8, 2021, when the price reached approximately $0.74.The surge was primarily driven by a combination of Elon Musk’s repeated tweets and endor
Dogecoin Marketcap Explained: What It Means and How It Shapes DOGE’s Value
Key TakeawaysMarket capitalization (market cap) measures the total dollar value of Dogecoin (DOGE), calculated as current price × circulating supply.As of December 2025, Dogecoin’s market cap stands a
Dogecoin Price History: Major Cycles, Market Drivers, and Key Lessons
Key TakeawaysDogecoin has experienced extreme volatility, moving from near dormancy (2013–2020) to meme-driven surges (2021) and significant post-2021 corrections.The explosive 2021 surge drove DOGE t
İlgili Makaleler
How to Verify My Residential Address on MEXC
Providing proof of address (POA) is part of MEXC's KYC verification process. After registering a MEXC account, you must upload a POA document to complete identity verification and ensure compliance wi
Dogecoin Marketcap Explained: What It Means and How It Shapes DOGE’s Value
Key TakeawaysMarket capitalization (market cap) measures the total dollar value of Dogecoin (DOGE), calculated as current price × circulating supply.As of December 2025, Dogecoin’s market cap stands a
What Are Prediction Futures?
Cryptocurrency futures trading attracts countless investors with its high leverage and the ability to profit in both rising and falling markets. However, its complex mechanisms such as margin, leverag
Calculation of Futures Yield and Trading Fees
When trading futures on MEXC or other major exchanges, your trading PNL is based on three components:Trading Fees: The cost incurred during the transaction.Funding Fees: Periodic settlements based on
