For many beginner traders, discovering technical indicators feels like finding a cheat code to the stock market. You load up a chart, overlay the MACD, add an RSI, plot three moving averages, andFor many beginner traders, discovering technical indicators feels like finding a cheat code to the stock market. You load up a chart, overlay the MACD, add an RSI, plot three moving averages, and
新手学院/Trading Guide/US Stocks/How to Use ...r Trap You)

How to Use Technical Indicators in Stock Trading: When MACD, RSI, and Moving Averages Help (or Trap You)

中阶
Jun 26, 2026Emma Williams
0m
Polytrade
TRADE$0.03418-3.85%
4
4$0.021966+4.53%
ONEchain
CROSS$0.14072+13.90%
For many beginner traders, discovering technical indicators feels like finding a cheat code to the stock market. You load up a chart, overlay the MACD, add an RSI, plot three moving averages, and suddenly you feel like you can predict the future.
Then reality hits. The MACD gives a "golden cross," but the stock plummets. The RSI screams "oversold," but the stock keeps dropping for another week. You realize your chart looks like a bowl of spaghetti, and you are losing money faster than before.
Advanced U.S. stock trading requires a fundamental shift in perspective: Technical indicators do not predict the future; they measure the past. This guide breaks down exactly what technical indicators are designed to do, when they actually provide an edge, and most importantly, when they will actively mislead you.

Key Takeaways


  • Indicators are not crystal balls. They are mathematical formulas derived purely from historical price and volume.
  • Environment dictates effectiveness. Trend indicators fail in choppy markets, and oscillators fail in strong trending markets.
  • "Overbought" is not a sell signal. In a strong bull market, an RSI can stay overbought for months.
  • Confluence is king. Indicators only work when combined with pure price action, volume confirmation, and an awareness of macroeconomic catalysts.


What Technical Indicators Are Actually Designed to Do


The biggest mistake traders make is treating indicators as buy and sell signals. An indicator is simply a tool to help you visualize market state, momentum, and historical boundaries.

According to Investopedia’s core definition of technical analysis, this discipline evaluates investments by analyzing statistical trends gathered from trading activity, such as price movement and volume—ignoring the intrinsic value or fundamentals of the company.

Because they are derived from past data, all technical indicators are lagging. They tell you what has happened, which helps you structure the probability of what might happen next. If you are looking for an indicator to tell you exactly what a stock will do tomorrow, you are playing a losing game.

Trend Indicators vs. Momentum Indicators: The 2 Core Categories


To stop misusing indicators, you must understand the two primary families they belong to. Using three indicators that all do the exact same thing is a recipe for confirmation bias.

  1. Trend Indicators (e.g., Moving Averages, Parabolic SAR): These smooth out price data to help you identify the broader direction of the market. They work beautifully when a stock is trending up or down, but they will generate endless false signals when a stock is trading sideways.

  1. Momentum Indicators / Oscillators (e.g., RSI, MACD, Stochastic): These measure the speed and change of price movements. They are bound within a range (oscillating) and are designed to identify extreme short-term conditions (overbought/oversold) or shifts in momentum.

Why Market Environment Matters More Than a Single Indicator


You can have the best MACD strategy in the world, but if you apply it to the wrong market environment, you will be chopped to pieces. Market context dictates which tools you pull from your toolbox.
  • Trending Markets: The stock is making higher highs and higher lows. Here, Moving Averages act as excellent dynamic support.
  • Choppy / Range-Bound Markets: The stock is stuck in a box. Trend indicators will fail here, crossing over each other endlessly. This is where range indicators (like Bollinger Bands) and oscillators (like RSI) become more useful for identifying the top and bottom of the box.


When Moving Averages (MAs) Can Help


Moving Averages are the backbone of technical trading because they provide immediate visual context for the trend.

  • The 20-Day MA (Short-Term): Used by active swing traders to ride short-term momentum. If a stock is consistently closing above the 20 MA, the short-term trend is firmly bullish.
  • The 50-Day MA (Medium-Term): The ultimate institutional trendline. Many mutual funds and hedge funds use the 50-day moving average as a line in the sand to add to winning positions or cut losers.
  • The 200-Day MA (Long-Term): The macroeconomic dividing line. Generally speaking, a stock trading below its 200-day moving average is in a bear market, and a stock above it is in a bull market.
When they help: Buying pullbacks (retests) to a rising 50-day moving average in a confirmed uptrend is one of the highest-probability setups in the market.

The RSI and MACD Trap: When Momentum Indicators Mislead


This is where retail traders lose the most money.

The RSI Trap: The Relative Strength Index (RSI) measures momentum on a scale of 0 to 100. Textbooks say an RSI above 70 is "overbought" (time to sell) and below 30 is "oversold" (time to buy). This is highly misleading. When a stock like Nvidia or Tesla enters a massive, euphoric breakout, the RSI can stay pegged above 80 for weeks. If you short a stock just because the RSI hit 75, you will likely get run over.

The MACD Trap: The Moving Average Convergence Divergence (MACD) shows the relationship between two moving averages. A "golden cross" happens when the fast line crosses above the slow line. However, because the MACD is a lagging indicator of a lagging indicator, by the time the cross happens on a daily chart, the actual price move has often already occurred.

Charles Schwab’s guide to technical indicators emphasizes that indicators like MACD and RSI are best used to spot divergences (e.g., the stock makes a new high, but the MACD makes a lower high), rather than treating their standard crosses as absolute buy/sell triggers.


How to Combine Indicators With Price, Volume, and Market Context


If an indicator alone isn't enough, how do advanced traders use them? Through confluence—stacking probabilities in your favor.

A professional setup looks like this:
  1. Price Structure: The stock breaks out of a multi-week consolidation box.
  2. Volume Confirmation: The breakout occurs on double the average daily trading volume. How to Read U.S. Stock Market Signals: Price Action, Volume, and Breakouts
  3. Indicator Support: The MACD is trending upward, and the stock is holding comfortably above the 20-day moving average.
  4. Catalyst: The move is backed by a strong earnings report.
When price, volume, and indicators agree, you have a high-probability trade.

4 Fatal Mistakes Traders Make With Technical Analysis

  1. Indicator Spaghettification: Loading 8 different indicators onto a single chart. This leads to "analysis paralysis" because one indicator will always contradict another. Keep your charts clean.
  2. Ignoring the Fundamentals: Buying a technically "perfect" setup the day before the company reports earnings. Earnings reports act as massive reset buttons that destroy technical setups in seconds.
  3. Blindly Trading Crosses: Buying solely because two lines crossed on a screen, without looking at the broader market trend or sector health.
  4. Neglecting Risk Management: Believing a technical setup is so strong that you don't need a stop-loss. FINRA frequently warns active traders that outsized volatility can invalidate any technical setup, making strict risk controls mandatory.

Your Pre-Trade Technical Indicator Checklist

Before entering a trade based on technicals, run through this mental checklist:
  • [ ] What is the environment? Am I in a clear trend, or is the market chopping sideways?
  • [ ] Is price leading? Am I buying a real price breakout, or just an indicator crossover?
  • [ ] Does volume confirm? Is there institutional fuel behind this move?
  • [ ] Are there event risks? Is there an earnings report, Fed meeting, or CPI data drop tomorrow?
  • [ ] Where am I wrong? If the setup fails, exactly which price invalidates this trade?

Continue building your advanced trading framework with these internal resources:

FAQ

Can I trade profitably using only technical indicators?

It is extremely difficult. Algorithms execute purely technical strategies much faster than humans. Retail traders find their edge by combining technical indicators with context—understanding why a stock is moving (catalysts, sector rotation) and managing risk aggressively.

What are the best moving averages to use for swing trading?

The 20-day (or 21-day) Exponential Moving Average (EMA) and the 50-day Simple Moving Average (SMA) are the most widely respected by swing traders and institutions. The 20-day acts as short-term momentum support, while the 50-day acts as the structural trendline.

Why does my MACD golden cross keep failing?

Because the MACD is a lagging indicator. If you buy a golden cross during a choppy, sideways market, you will likely buy exactly at the top of the range just before the stock reverses. MACD crosses are only reliable when they align with a broader, confirmed price trend.
市场机遇
Polytrade 图标
Polytrade实时价格 (TRADE)
$0.03418
$0.03418$0.03418
-0.87%
USD
Polytrade (TRADE) 实时价格图表

热门加密动态

查看更多
MEXC 链上观察日报:《CLARITY法案》年内立法预期转空

MEXC 链上观察日报:《CLARITY法案》年内立法预期转空

更新于:2026年7月20日 9:30(UTC+8)|作者:MEXC 1. 要闻速览 Cardano完成首次全链上治理硬分叉 《CLARITY法案》年内立法预期转空 Tether剩余两年确定美国合规策略 韩国将建设韩元稳定币支付基础设施 Uniswap新增协议费用将用于销毁UNI 2. 产业动态 巴基斯坦加密监管机构推动区分投机型加密货币与资产支持型代币 据Odaily星球日报消息,巴基斯坦虚拟资

三星SK海力士暴跌:韩国股市熔断背后,谁在把首尔当提款机?

三星SK海力士暴跌:韩国股市熔断背后,谁在把首尔当提款机?

韩国KOSPI单日暴跌逾8%触发熔断,三星电子盘中重挫10%。这不是普通的技术性调整,而是美联储加息预期骤升、全球宏观对冲基金被迫平仓、日元套利交易瓦解三重压力同时释放的结果。本文从流动性踩踏与外资套利平仓的底层逻辑,还原这场"提款机"式抽资的完整路径。 概述 2026年6月8日,韩国综合股价指数(KOSPI)盘中暴跌逾8%,直接触发熔断机制,交易被迫停摆20分钟。三星电子与SK海力士盘中双双下挫

Top REPPO Exchanges: Security and UX Compared

Top REPPO Exchanges: Security and UX Compared

Introduction to REPPO Trading Platform Selection 选择正确的Reppo(REPPO)交易平台是一个关键决定,它可以显著影响您的交易成功和安全。随着Reppo(REPPO)在加密货币市场持续获得动力,投资者需要一个既安全又易用的可靠交易所。您选择的平台不仅决定了您购买、出售和交易Reppo(REPPO)的便捷程度,还决定了您的资产免受潜在安全威胁的安全

Mobile Trading Guide for Binancelife (formerly BIANRENSHENG): Trade Anytime, Anywhere

Mobile Trading Guide for Binancelife (formerly BIANRENSHENG): Trade Anytime, Anywhere

移动交易 Binancelife 简介 Binancelife (formerly BIANRENSHENG) 是一种在 BNB 链上推出的创新型迷因币,它取得了非凡的增长,在成立后仅三天内就达到了 3 亿美元的市值。在当今快节奏的加密货币市场中,通过移动设备交易 Binancelife (formerly BIANRENSHENG) 对于休闲投资者和活跃交易者来说都变得至关重要。由于加密货币市场

热门新闻

查看更多
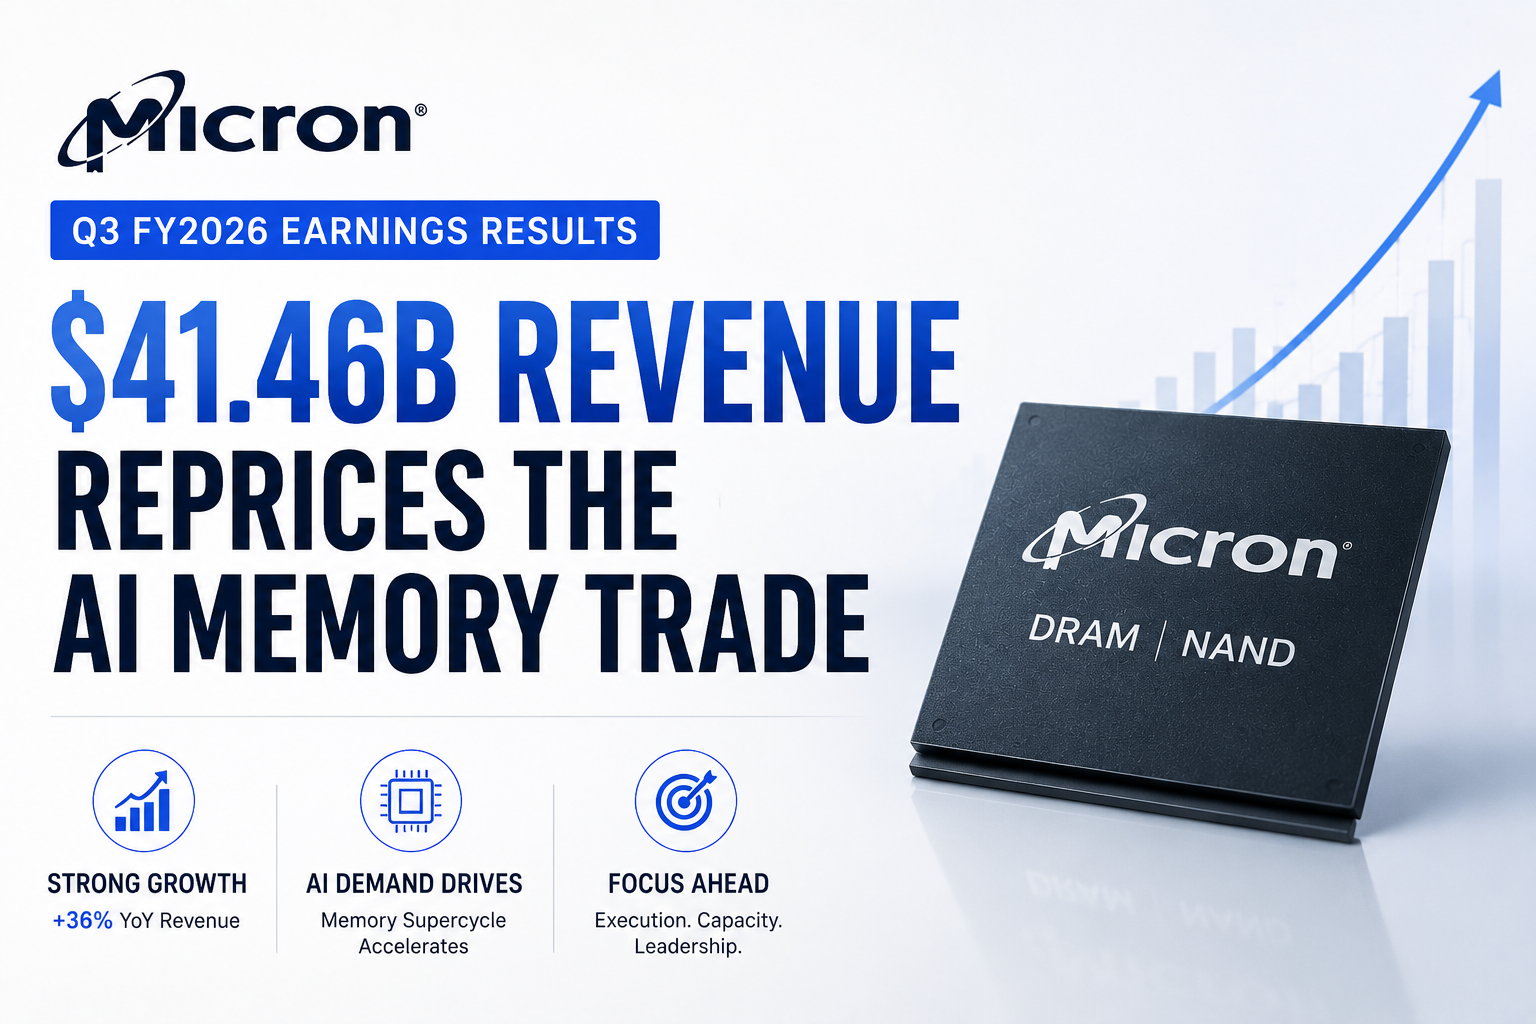
美光2026财年第三季度财报:414.6亿美元营收重塑AI存储交易

美光2026财年第三季度财报:414.6亿美元营收重塑AI存储交易

美光科技发布了创纪录的2026财年第三季度财报,由于人工智能相关内存和存储的需求持续超过供应,公司营收达到414.6亿美元,大幅高于去年同期的93.0亿美元。非公认会计准则(Non-GAAP)摊薄后每股收益(EPS)升至25.11美元,非公认会计准则毛利率扩大至84.9%。公司还预计第四财季营收约为500亿美元,上下浮动10亿美元。这并非普通的财报新闻,因为美光已不再仅仅被视为具有周期性的DRAM
2026年英伟达年度股东大会:黄仁勋的“AI工厂”理论面临下一次市场考验

2026年英伟达年度股东大会:黄仁勋的“AI工厂”理论面临下一次市场考验

英伟达于太平洋时间2026年6月24日上午9:00在线召开了2026年年度股东大会。正式议程包括选举董事、对高管薪酬进行咨询性表决、批准独立审计机构以及多项股东提案。然而,对于市场而言,这次会议的意义远超常规的年度公司治理。这是在经历了一年创纪录的营收增长后,对英伟达能否继续捍卫其AI基础设施主导地位的又一次考验。 尽管部分亚太地区的投资者是在当地时间6月25日关注此次会议,但官方的会议时间定于太

从稀缺交易到估值纪律:SpaceX的回调考验OpenAI的IPO雄心

从稀缺交易到估值纪律:SpaceX的回调考验OpenAI的IPO雄心

据报道,OpenAI倾向于将IPO推迟到2027年,但更强烈的市场信号来自SpaceX 。SpaceX在6月22日收盘下跌16.4%至154.60美元,较其225.64美元的盘中高点下跌31.5%,但仍比其135美元的IPO发行价高出14.5% 。这一走势使SpaceX从一个纯粹由稀缺性驱动的IPO成功案例,变成了AI相关超级上市周期的首个重大公开市场压力测试 。OpenAI的问题不在于需求,而在

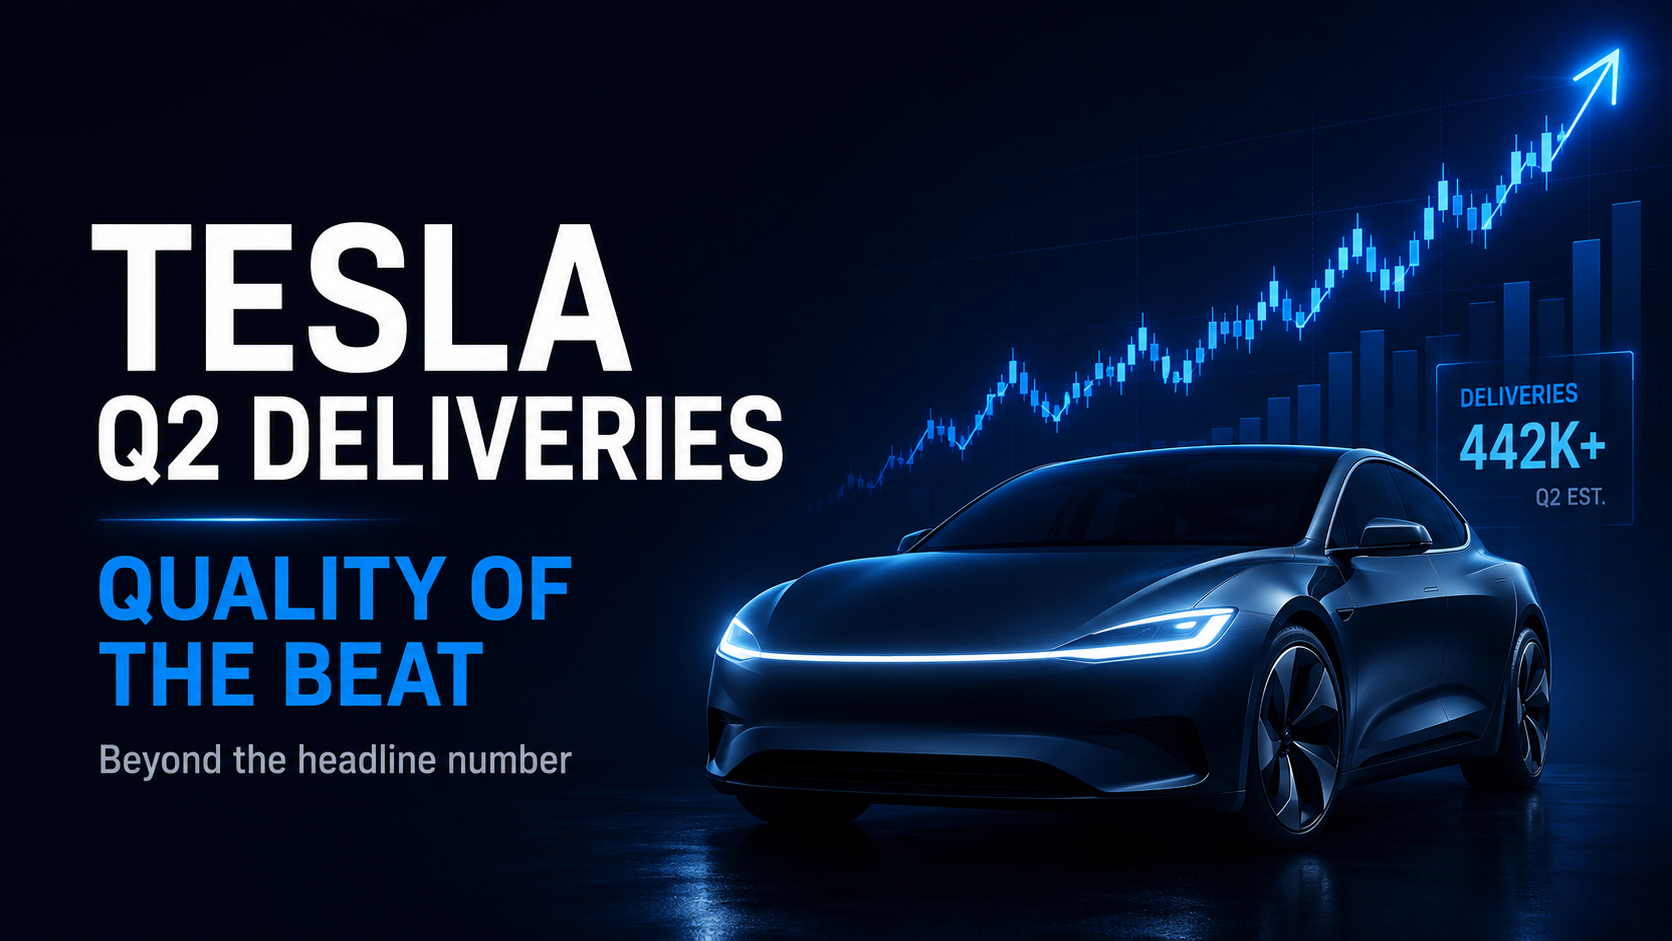
特斯拉交付前股价大涨:为什么真正的考验在于质量,而非数量

特斯拉交付前股价大涨:为什么真正的考验在于质量,而非数量

特斯拉(TSLA)在第二季度交付报告公布前股价大涨 8.46% 至 411.84 美元,表现优于大盘,分析师称其为“预期重置交易”。华尔街已大幅提高门槛,主要机构将“耳语预测”(whisper numbers)上调至 413,024 至 420,000 辆之间,远高于公司官方统计的 406,024 辆共识预期。尽管监管压力的缓解以及与 Sunrun 达成的 16GW 虚拟电厂巨额合作,对特斯拉的能

相关文章

查看更多
辉达股价预测:AI 热潮开始侵蚀辉达自己的利润了吗?

辉达股价预测:AI 热潮开始侵蚀辉达自己的利润了吗?

辉达的毛利率刚刚连续第三季度维持在接近 75% 的水准。 而在同一份新闻稿里,公司下修了这个数字的指引。 营收仍在加速——截至 2026 年 7 月 26 日的当季达 962 亿美元,比一年前的两倍还多,而下一季的指引则是 1,080 亿美元。 也就是说,公司一边加速增长,一边在每一美元营收上赚得更少;而这一组张力解释了大部分的原因,这组张力也是为什么覆盖同一家公司的分析师,连一年后的目标价都无法

AI 推理正在改变 NAND 周期吗?Sandisk 对存储芯片股意味着什么

AI 推理正在改变 NAND 周期吗?Sandisk 对存储芯片股意味着什么

AI 推理需要的不只是算力,大规模部署同样需要不断增长、能够快速访问且具备成本效率的存储容量。 NAND 正逐步成为与 HBM、DRAM 并存的 AI 容量层,而不再只是传统商品型存储产品。 Sandisk 预计,到 2030 年企业数据中心闪存需求将达到 1.2 ZB,并正在开发专门面向 AI 推理的 High Bandwidth Flash。 Sandisk、Samsung 等存储厂商开始采用

2026 AI 基础设施股票:谁真正受益于 Big Tech 的 AI 资本支出?

2026 AI 基础设施股票:谁真正受益于 Big Tech 的 AI 资本支出?

Key Takeaways Microsoft、Amazon、Alphabet 和 Meta 在 2026 年仍在大规模投入 AI 基础设施和数据中心。 Nvidia 仍是最直接的 AI 资本支出受益者之一,但 AI 云、服务器、网络和光通信也开始呈现明确增长。 CoreWeave、Nebius、Dell 和 Broadcom 提供了 AI 支出转化为营收、订单和待履约收入最清晰的证据之一。 随着


苹果(AAPL)目标价与股价预测:产能跟不上,股价还能涨到 400 美元吗?

苹果(AAPL)目标价与股价预测:产能跟不上,股价还能涨到 400 美元吗?

Key Takeaways 华尔街对苹果的共识目标价为 321.66 美元,个别分析师的预估则从 215 美元到 400 美元不等。2026 年 7 月 30 日,尽管苹果交出史上最强的 6 月当季财报、营收达 1,094 亿美元,AAPL 仍在盘后延长时段下跌约 6%。服务业务与大中华区营收双双低于分析师预估,苹果并将 9 月当季营收成长业绩指引下修至 9% 至 11%。苹果表示瓶颈在于供给而非

注册MEXC账号
注册 & 获得高达10,000 USDT奖金
您的稳定币真的安全吗?
您的稳定币真的安全吗?您的稳定币真的安全吗?
了解 USDT、USDC、OpenUSD 及 USD1 的风险