Can Dogecoin Sustain Its Recovery Above $0.135?
- Dogecoin is holding key support levels, showing early signs that selling pressure is weakening.
- A breakout above the $0.140–$0.145 resistance zone is needed to confirm any trend reversal.
Dogecoin has entered 2026 on a relatively stable note, trading around $0.13554 at the time of writing, a 11% recovery after weeks of sustained downside pressure. After declining steadily from higher levels of $0.30 to $0.116 in late 2025, DOGE has now started moving sideways, suggesting that selling momentum may be slowing down. The daily chart shows Dogecoin attempting to hold above the $0.130 support zone, an area that has repeatedly attracted buyers in recent sessions.
According to TradingView data, DOGE recently printed an intraday high near $0.1377, while downside remains capped above $0.125, indicating a narrow consolidation range. This price behavior points to hesitation among traders rather than aggressive selling, which often appears during the early stages of a potential base formation.
DOGE Holds Crucial Support as Resistance Caps Upside
From a technical point of view, Dogecoin has been trading below its main moving averages for quite some time, showing that the overall trend is still weak. On the daily chart, the 50-day moving average is near $0.145, while the 100-day moving average is around $0.165, both sitting well above the current price and acting as resistance. That said, price movement has recently started to level out in the $0.125–$0.135 range, which could suggest that selling pressure is slowing rather than continuing to push prices lower.
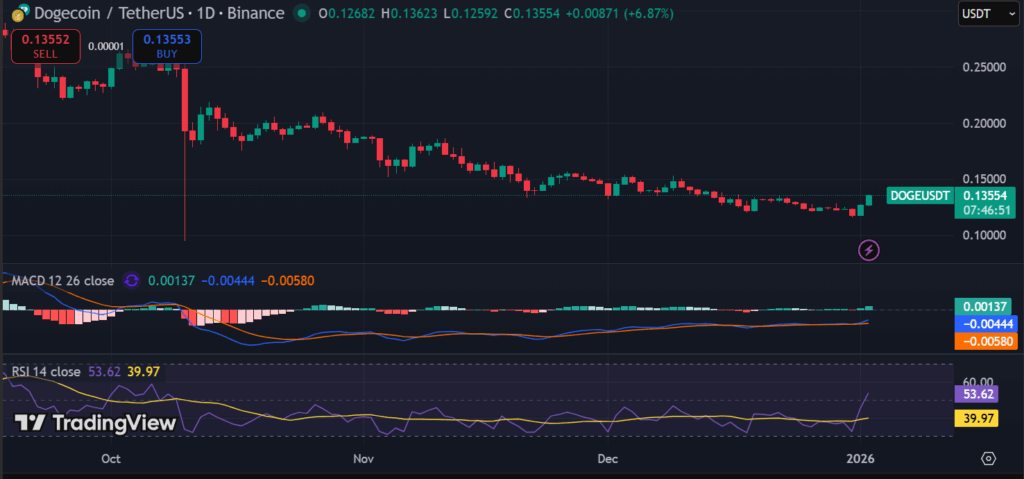 (Source: TradingView)
On the other side, the RSI on the daily chart has moved up to around 53, staying above the neutral 50 level and well below the overbought range. This indicates that selling pressure is easing and buyers are slowly stepping back in. Rather than showing weakness, DOGE appears to be entering a mild recovery phase after its recent decline. In many cases, this kind of RSI movement following a long downtrend points to early stability or a short-term bounce.
Meanwhile, the MACD indicator is still below the zero line, which suggests that the overall trend remains on the weaker side. That said, the MACD histogram has turned positive, and the gap between the MACD line and the signal line is narrowing. This shows that downside momentum is gradually fading, even though a clear bullish crossover has not yet formed.
Looking at trend strength, the ADX remains low, suggesting that Dogecoin is not showing a strong directional trend right now. This fits with the current price action, where DOGE is moving within a tight range on the daily chart, indicating consolidation rather than sharp moves in either direction.
Current Trend Outlook
In terms of key price levels, Dogecoin is currently finding support between $0.130 and $0.125. If the price manages to stay above this range, it could slowly move back toward the $0.140–$0.145 resistance zone, which previously acted as a breakdown area. A clear move above this region may allow DOGE to test the $0.15 level in the short term. However, if the price slips below $0.125, it could lead to further weakness, with the next downside area seen around $0.11.
Overall, Dogecoin is trading in a downward consolidation phase after a long period of decline. While the broader trend is still on the weaker side, recent price action and indicators suggest that the market is starting to stabilize, as selling pressure appears to be easing near key support levels.
You May Also Like

IP Hits $11.75, HYPE Climbs to $55, BlockDAG Surpasses Both with $407M Presale Surge!

LINK Price Prediction: Targeting $14.50 Breakout in Q1 2026 Amid Cautious Optimism