

Cardano (ADA) Price: Breaks Falling Wedge Pattern as Traders Pile Into Long Positions
TLDR
- Cardano (ADA) broke above a falling wedge pattern and is trading around $0.40 on Monday.
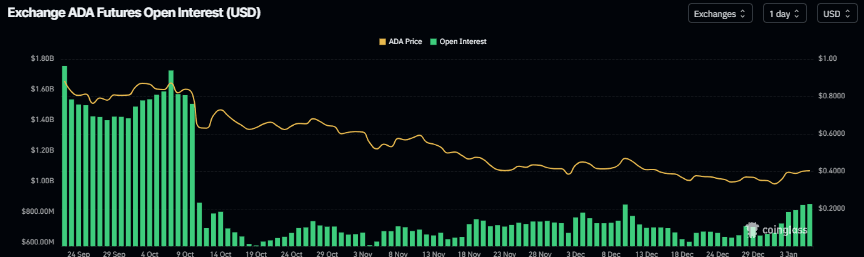
- Open interest in Cardano futures jumped from $644 million to $851 million, the highest level since mid-December.
- The long-to-short ratio climbed to 1.06, showing more traders are betting on price increases.
- Technical indicators show bullish momentum with RSI at 55 and a MACD bullish crossover.
- Geopolitical tensions involving US actions in Venezuela and comments about Colombia could limit further price gains.
Cardano price is holding steady above $0.40 on Monday after closing above a falling wedge pattern last week. The move represents a technical shift that has caught the attention of traders watching the cryptocurrency’s price action.
 Cardano (ADA) Price
The falling wedge pattern formed over several months by connecting multiple highs and lows with two trendlines since mid-October. ADA successfully broke through the upper trendline on Friday and maintained gains through the weekend.
Trading data shows improving conditions in the derivatives market. Cardano futures open interest at exchanges increased to $851.17 million on Monday. This compares to $644.34 million on Tuesday of last week.
 Source: Coinglass
The open interest figure marks the highest level for Cardano since mid-December. Rising open interest indicates new money entering the market and fresh buying activity. This metric often correlates with the strength of a price movement.
The long-to-short ratio for Cardano has been climbing steadily and reached 1.06 on Monday. This ratio sits near its monthly high. A reading above one means more traders are placing long bets than short bets.
Technical Indicators Point to Bullish Momentum
The Relative Strength Index on the daily chart currently reads 55. This sits above the neutral level of 50. The positioning suggests bullish momentum is building.
The Moving Average Convergence Divergence indicator recently showed a bullish crossover. Rising green histogram bars above the neutral level support the positive technical outlook.
If Cardano maintains its current trajectory, the next resistance level sits at $0.42. This level aligns with the 50-day Exponential Moving Average. A daily close above this point could open the door to $0.49.
One analyst noted that Cardano shows a bullish RSI divergence. The RSI formed higher lows while price previously printed lower lows. This pattern often signals that selling pressure is weakening before price confirms a breakout.
Another technical analyst pointed out that Cardano broke its primary downtrend for the first time since October 2025. The descending trendline had capped every major rally attempt throughout the recent correction period.
Geopolitical Events Create Uncertainty
External factors could affect Cardano’s price direction. The US carried out a large-scale military strike against Venezuela on Saturday. Venezuelan President Nicolás Maduro and his wife were captured during the operation.
At a press conference on Saturday, US President Donald Trump said Maduro and his wife will both face US justice. Trump added that the US will be running Venezuela until a safe and proper transition can occur.
Trump made additional comments on Monday about Colombia. He stated that Colombia is run by a sick man and suggested openness to potential US intervention. These remarks raised concerns about expanding geopolitical tensions in the region.
These developments add to existing geopolitical issues including the Russia-Ukraine situation, unrest in Iran, and ongoing Gaza concerns. Such tensions typically benefit the US Dollar as the global reserve currency.
Risk-off sentiment triggered by geopolitical events could pressure cryptocurrencies like Cardano. Traders holding ADA should monitor these situations as they develop.
If Cardano faces selling pressure, technical support sits at $0.32. This level corresponds to Wednesday’s low from last week.
The post Cardano (ADA) Price: Breaks Falling Wedge Pattern as Traders Pile Into Long Positions appeared first on CoinCentral.
You May Also Like

Telegram Sells $450M In Toncoin As Token Plunges: Report

Polymarket Adds Taker Fees to 15-Minute Crypto Markets
