

Ethereum price news: ETH holds above $3,200 while intraday structure softens

ETH is trading just above key support with mixed signals across timeframes, making today's Ethereum price news particularly relevant for short-term traders and swing participants.
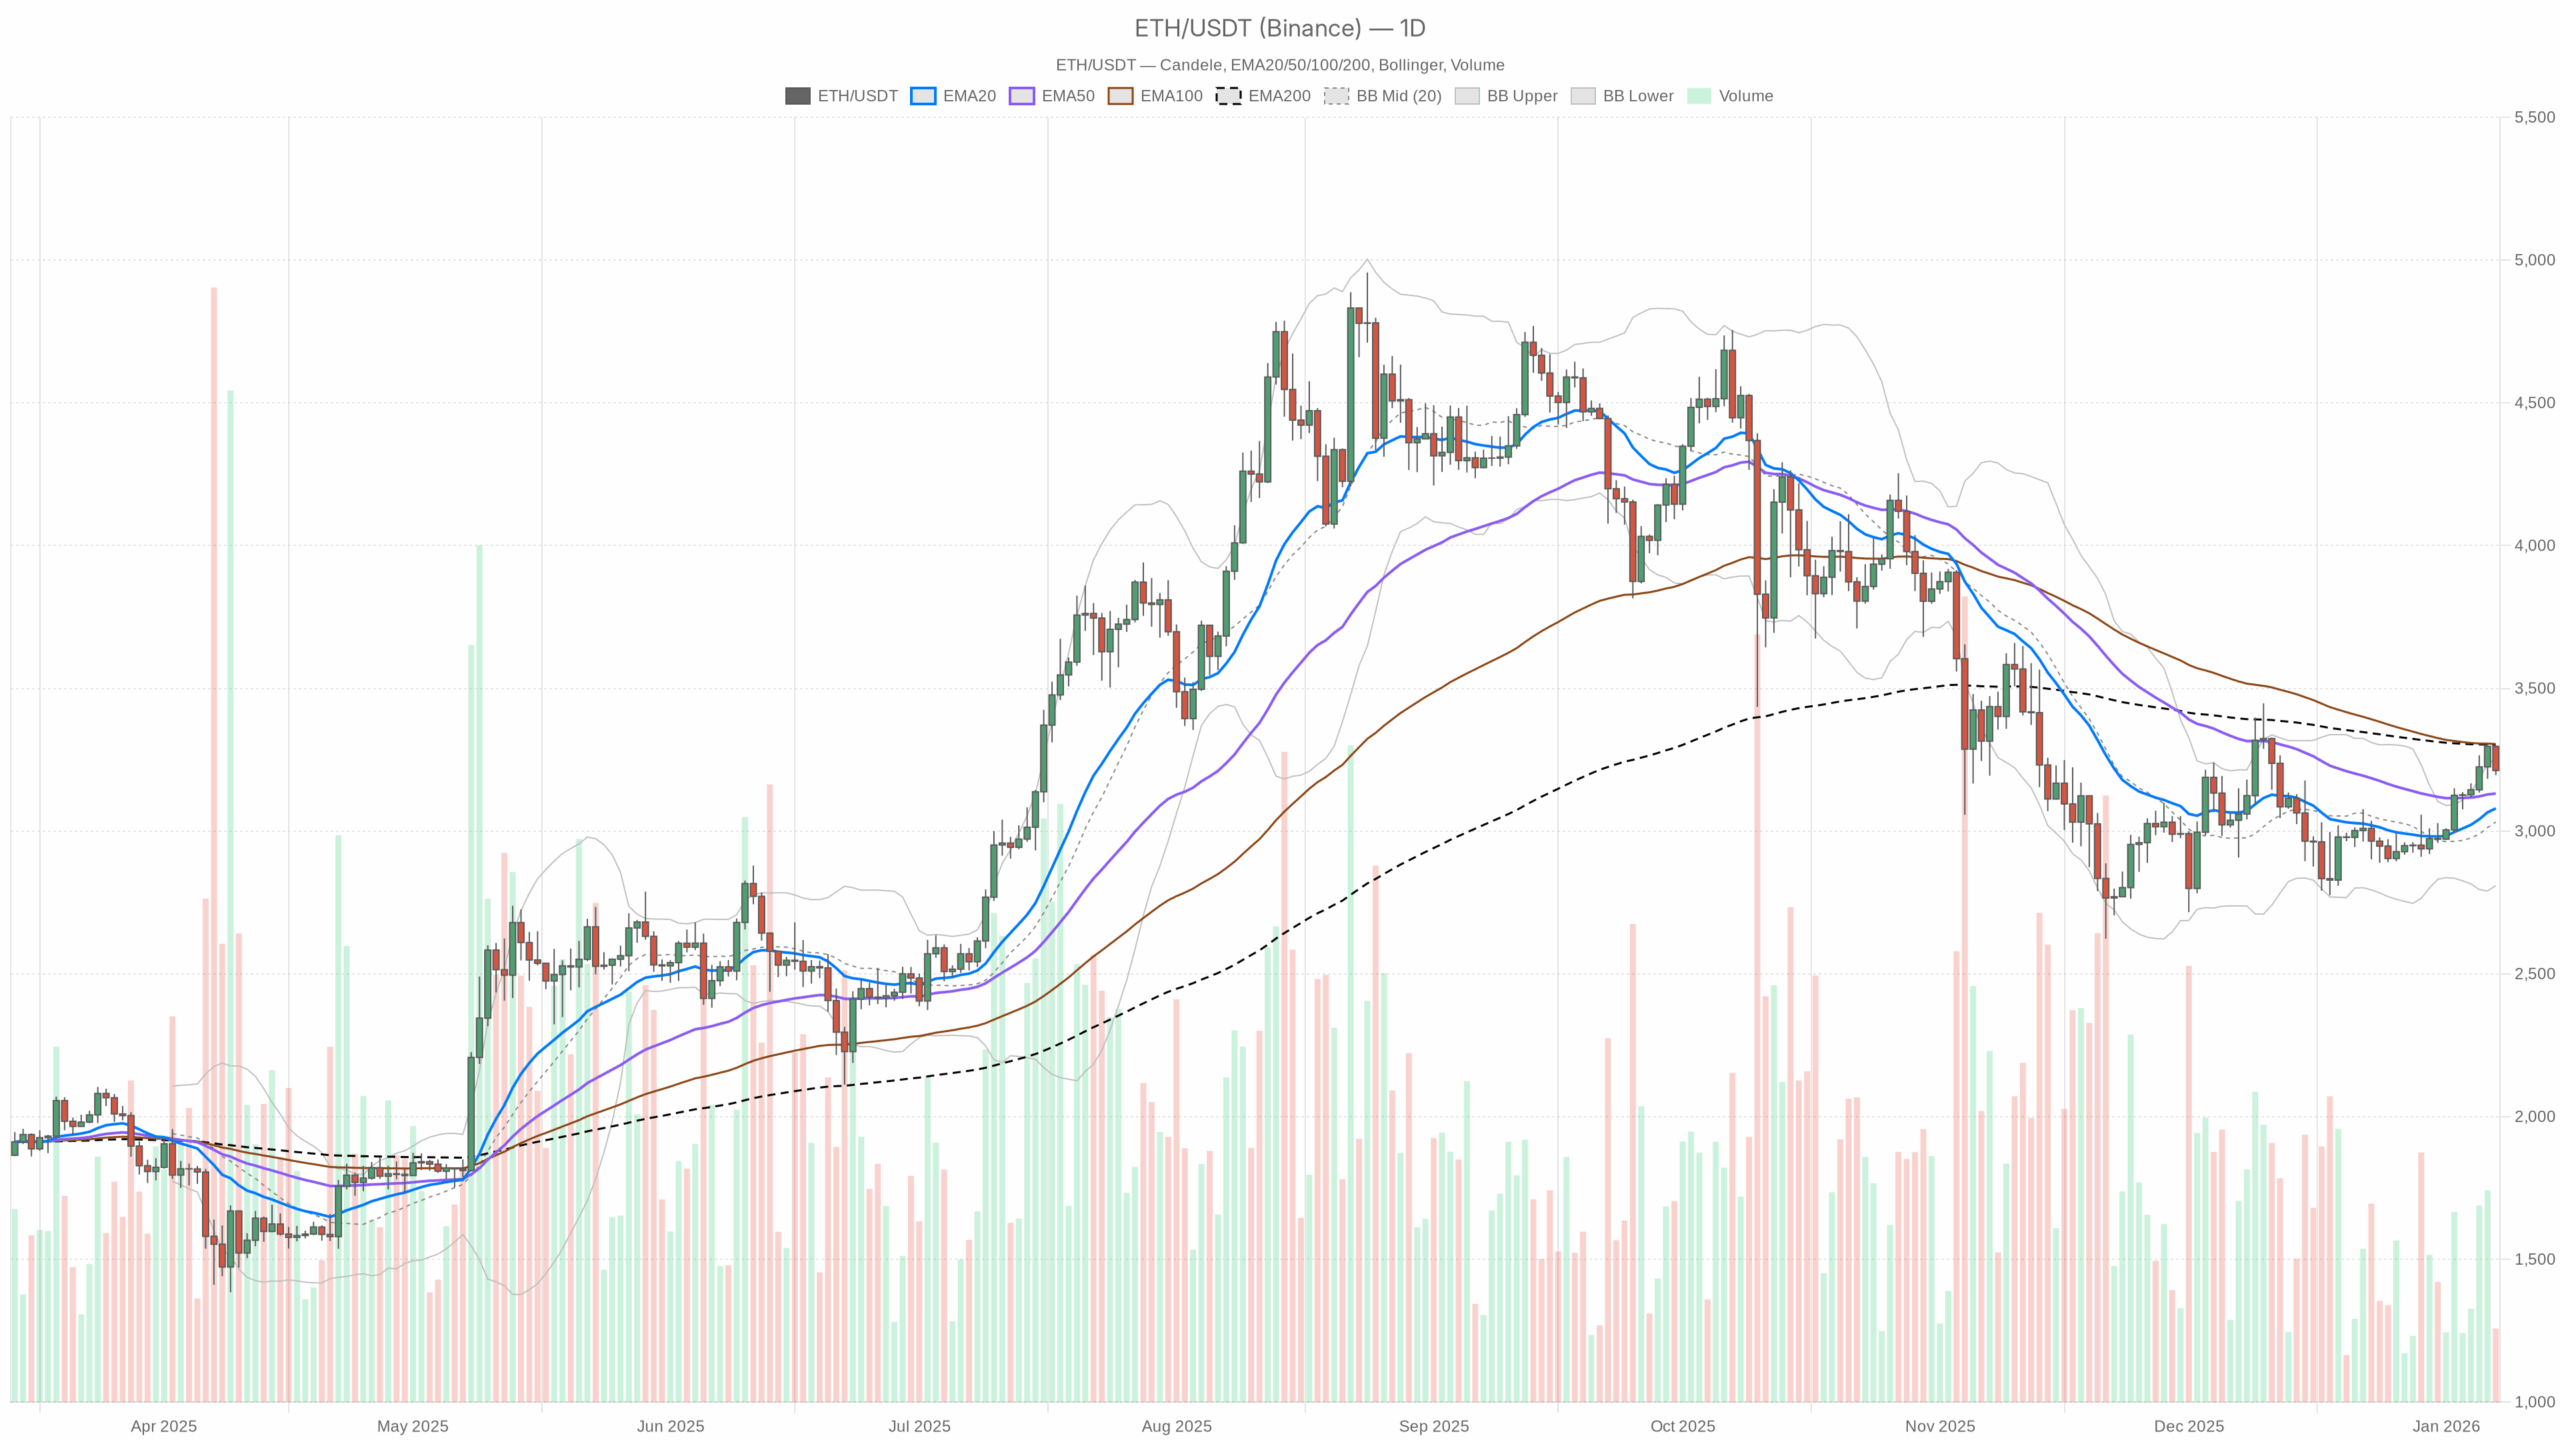 ETH/USDT — daily chart with candlesticks, EMA20/EMA50 and volume.
Daily chart (D1): Macro bias – cautiously bullish above $3,100
On the daily timeframe, the main scenario is bullish, but it is a work-in-progress rather than a clean breakout.
Trend and EMAs
Daily close: $3,212
EMA20: $3,079 | EMA50: $3,132 | EMA200: $3,302
Price is trading above the 20-day EMA and is essentially re-testing the 50-day EMA from above, while still below the 200-day EMA.
What this implies: Short- and medium-term trend structure has turned constructive again, so buyers have regained the tactical upper hand. However, the broader, longer-term trend (vs the 200-day) is still not fully repaired. ETH is in a recovery phase inside a larger consolidation, not in a clear macro uptrend yet.
RSI (momentum)
RSI 14 (D1): 60.6
What this implies: Momentum is on the bullish side of neutral without being overheated. There is room for price to extend higher before the move looks stretched. It reflects steady buying rather than a blow-off move.
MACD (trend strength)
MACD line: 44.2 | Signal: 5.5 | Histogram: +38.7
What this implies: The MACD is firmly in positive territory with a wide gap over the signal line. Trend-following flows are shifting in favor of the bulls. However, the histogram is already quite elevated, which often precedes a slowdown or sideways digestion even if the broader up-leg remains intact.
Bollinger Bands (volatility envelope)
Middle band: $3,031 | Upper band: $3,254 | Lower band: $2,810
Price: $3,212 (trading between mid and upper band, relatively close to the top)
What this implies: ETH is riding the upper half of its volatility envelope, which is typical of an advancing market, but it is not pinned to the band. That points to a constructive up-move with controlled volatility rather than an explosive, unstable breakout. Pullbacks towards the middle band (~$3,030) would be normal, not necessarily trend-ending.
ATR (volatility)
ATR 14 (D1): $87.9
What this implies: Average daily range is under $100, which is moderate for ETH at these levels. Volatility is elevated enough to offer trading opportunity but not in panic territory. That favors swing setups with defined risk rather than lottery-style breakouts.
Daily pivots (reference levels)
Pivot point (PP): $3,235
First resistance (R1): $3,274
First support (S1): $3,173
ETH is currently trading a bit below the daily pivot, closer to S1 than R1.
What this implies: On today's session structure, the market is leaning slightly defensive intraday even though the broader daily trend is constructive. Bulls have not seized control of the session; they are defending rather than aggressively pressing higher.
1-hour chart (H1): Short-term bias – neutral to mildly bearish
The hourly chart is where the tension shows up: daily signals are constructive, but the 1H looks like a minor distribution phase after the recent push.
Trend and EMAs
Hourly close: $3,211
EMA20: $3,236 | EMA50: $3,224 | EMA200: $3,127
Price is below the 20 and 50-hour EMAs but still comfortably above the 200-hour EMA.
What this implies: The short-term intraday trend is softening, as sellers have nudged price under the fast intraday averages. Nevertheless, the broader intraday structure since the last swing low remains intact. It looks more like a pullback in an emerging uptrend than a full trend reversal, at least as long as ETH holds above the 200-hour near $3,130.
RSI (momentum)
RSI 14 (H1): 43
What this implies: Momentum on the hourly is slightly negative, consistent with a mild cooldown. It is not extreme enough to signal capitulation or breakout pressure, but more of a controlled breather where sellers have the short-term initiative.
MACD (trend strength)
MACD line: -4.4 | Signal: 2.6 | Histogram: -7.1
What this implies: The hourly MACD has flipped into negative territory, confirming that the last upswing has lost steam. Trend followers on short timeframes are likely de-risking or waiting for a fresh signal. This contradicts the bullish daily MACD and underscores that the current move is a pullback within a larger, still-constructive structure.
Bollinger Bands
Middle band: $3,245 | Upper band: $3,296 | Lower band: $3,194
Price: $3,211, trading close to the lower band
What this implies: Price hugging the lower band on H1 is classic short-term pressure. However, with the daily still strong, this kind of lower-band test often resolves into either a sideways base or a mean-reversion bounce, unless selling volume sharply accelerates.
ATR (volatility)
ATR 14 (H1): $23.3
What this implies: Typical hourly swings of low-to-mid $20s give enough room for tactical trades but do not indicate a volatility shock. The market is repricing gradually rather than collapsing.
Hourly pivots
Pivot point (PP): $3,214
R1: $3,226
S1: $3,199
Price is fractionally below the hourly pivot and closer to S1.
What this implies: In today's intraday structure, bears have a slight edge. A reclaim and hold above the hourly pivot would be an early sign that the pullback is running out of gas.
15-minute chart (M15): Execution context – controlled dip
The 15-minute chart is useful only to understand the very short-term tape; it does not define the broader bias.
Trend and EMAs
M15 close: $3,211
EMA20: $3,222 | EMA50: $3,235 | EMA200: $3,227
Price is below all three EMAs on the 15-minute.
What this implies: Very short-term, the market is in a local down-swing. This is where the pressure is most obvious, but this timeframe is noisy. It mainly tells us that sellers are in control of the latest leg of the intraday auction.
RSI (momentum)
RSI 14 (M15): 40.6
What this implies: Short-term momentum is weak but not oversold. There is room for one more push lower on this timeframe before bargain hunters typically step in.
MACD (trend strength)
MACD line: -8.1 | Signal: -9.1 | Histogram: +1.0
What this implies: Both MACD and signal are negative, but the histogram has ticked back above zero. That is often what you see during an early attempt to stabilize after a sell leg: the downtrend is still there, but the pace of selling is slowing and a short-term base may be forming.
Bollinger Bands
Middle band: $3,217 | Upper band: $3,233 | Lower band: $3,200
Price: $3,211, in the lower half of the band range
What this implies: ETH is sitting in the lower half of its very short-term volatility range, consistent with a pullback, but not yet at an extreme. That leaves room for either a marginal new low or a sideways chop before a clearer direction emerges.
ATR (volatility)
ATR 14 (M15): $9.6
What this implies: The typical 15-minute bar is moving under $10, pointing to orderly price action. This is not the kind of tape where you usually see forced liquidations; it is more algorithmic rebalancing and local profit taking.
15-minute pivots
Pivot point (PP): $3,214
R1: $3,216
S1: $3,209
Price is currently below the local pivot and closer to S1.
What this implies: Micro-structure favors sellers for now. Short-term scalpers will watch for either a rejection from the pivot/R1 area or a flush through S1 towards the lower 15m band near $3,200.
Market context: ETH vs the rest of crypto
ETH sits in a market where overall capitalization is drifting lower (total cap -1.65% in 24h), while volume is up nearly 10%. That is classic for a controlled risk-off rotation: traders are actively repricing, not walking away. Bitcoin dominance at 56.6% and a fear reading of 42 confirm that the crowd still prefers BTC and stable plays over broad altcoin risk.
On the structural side, DeFi activity on Ethereum-centric DEXs like Uniswap v3 and v4 is robust, with double-digit daily fee growth and very strong 7–30 day increases, while more curve-style venues show declining fees. That is consistent with a market concentrating liquidity and speculation on core DeFi rails rather than chasing every experimental venue. For ETH, this is a medium-term positive: network usage and fees are holding up even during a cautious macro tape.
Recent headlines, such as the Fortune piece framing 2026 as a fork in the road for Ethereum, underline the narrative pressure on ETH to justify its valuation through real scaling and execution. Price-wise, the market is not showing panic around that narrative. Instead, the chart shows a market willing to give ETH room as long as key supports hold. This aligns closely with the current Ethereum price news focus on resilience over euphoria.
Scenarios for ETHUSDT
Bullish scenario
The bullish case leans on the daily chart: positive MACD, RSI above 60, and price above the 20/50-day EMAs. In this scenario, the current intraday pullback is just a pause before continuation.
Key steps for bulls:
- On lower timeframes, ETH needs to reclaim the hourly pivot around $3,214 and then push back above the H1 20/50 EMA cluster ($3,224–3,236). That would signal the dip is being bought, not sold into.
- A daily close back above the D1 pivot at $3,235 and then through R1 near $3,274 would confirm demand is strong enough to challenge the upper Bollinger band and move toward the 200-day EMA around $3,300.
- If price can sustain above the $3,300–3,320 area (200-day EMA and prior supply), the narrative shifts toward a more durable uptrend rather than just a bounce in a range.
What invalidates the bullish scenario?
A decisive daily close below $3,100–3,120, where price would lose the 20-day EMA and drift away from the 50-day, would undercut the bullish structure. A breakdown under the hourly 200 EMA (~$3,130) with follow-through volume would be an early warning that the recovery leg is failing.
Bearish scenario
The bearish case is built from the hourly softness and macro backdrop: BTC dominance is high, the market is in fear, and ETH is still under its 200-day EMA. Here the current move is seen as another failed attempt to reclaim the longer-term trend.
Key steps for bears:
- Keep ETH suppressed under the hourly EMAs and maintain RSI on H1 below 50, turning each bounce into a lower high.
- Break below the immediate supports around $3,199 (H1 S1) and $3,173 (D1 S1), opening the door to a deeper mean reversion toward the daily middle Bollinger band and structural support near $3,050–3,030.
- If selling accelerates and price closes multiple hours, and especially a full day, below $3,000, the narrative shifts toward a larger range or even a retest of the lower band region in the $2,800–2,850 zone.
What invalidates the bearish scenario?
A strong reclaim of the $3,250–3,280 zone on convincing volume, with hourly indicators flipping back positive (MACD > 0, RSI back above 55–60) and a daily close north of the pivot and near R1, would put bears on the back foot. In that case, the current downturn would be downgraded to a simple intraday shakeout.
How to think about positioning right now
ETH is in one of those in-between spots: daily structure is constructive, intraday structure is corrective. That means directional conviction should come from the daily chart, while the lower timeframes guide timing and risk.
For traders, this is a market that rewards patience and clear invalidation rather than aggressive leverage. Volatility across timeframes (daily ATR ~ $88, hourly ATR ~ $23) is high enough that poor entries get punished quickly, but not so wild that everything is random. The key is to anchor decisions around the big levels:
- $3,100–3,130: line in the sand for the current daily up-leg.
- $3,235–3,275: intraday battle zone that decides whether this pullback is bought or sold.
- $3,300–3,320: major sentiment pivot tied to the 200-day EMA.
Uncertainty remains elevated due to the macro rotation into BTC, the fear reading, and the still-unresolved narrative around Ethereum's execution roadmap. That mix can create sharp, headline-driven spikes in both directions. Anyone active on this pair should size trades for adverse swings equal to at least one daily ATR and avoid assuming that today's intraday direction will necessarily define the whole week.
If you want to monitor markets with professional charting tools and real-time data, you can open an account on Investing using our partner link:
Open your Investing.com account
This section contains a sponsored affiliate link. We may earn a commission at no additional cost to you.
Disclaimer: This article is a market analysis and expresses a technical and opinionated view based on the data available at the time of writing. It is not financial advice, and it does not take into account your individual objectives, financial situation, or needs. Trading and investing in cryptocurrencies involves substantial risk, including the risk of loss of capital. Always conduct your own research and consider consulting a licensed financial professional before making investment decisions.


You May Also Like

Next Big Crypto to Hit $1? Mutuum Finance (MUTM) Prediction 2027-2028

The Chemistry of UV Resistance: How Titanium Dioxide Protects Against the California Sun


