

BNB price corrects into an order block with a bullish retest, reversal forming?
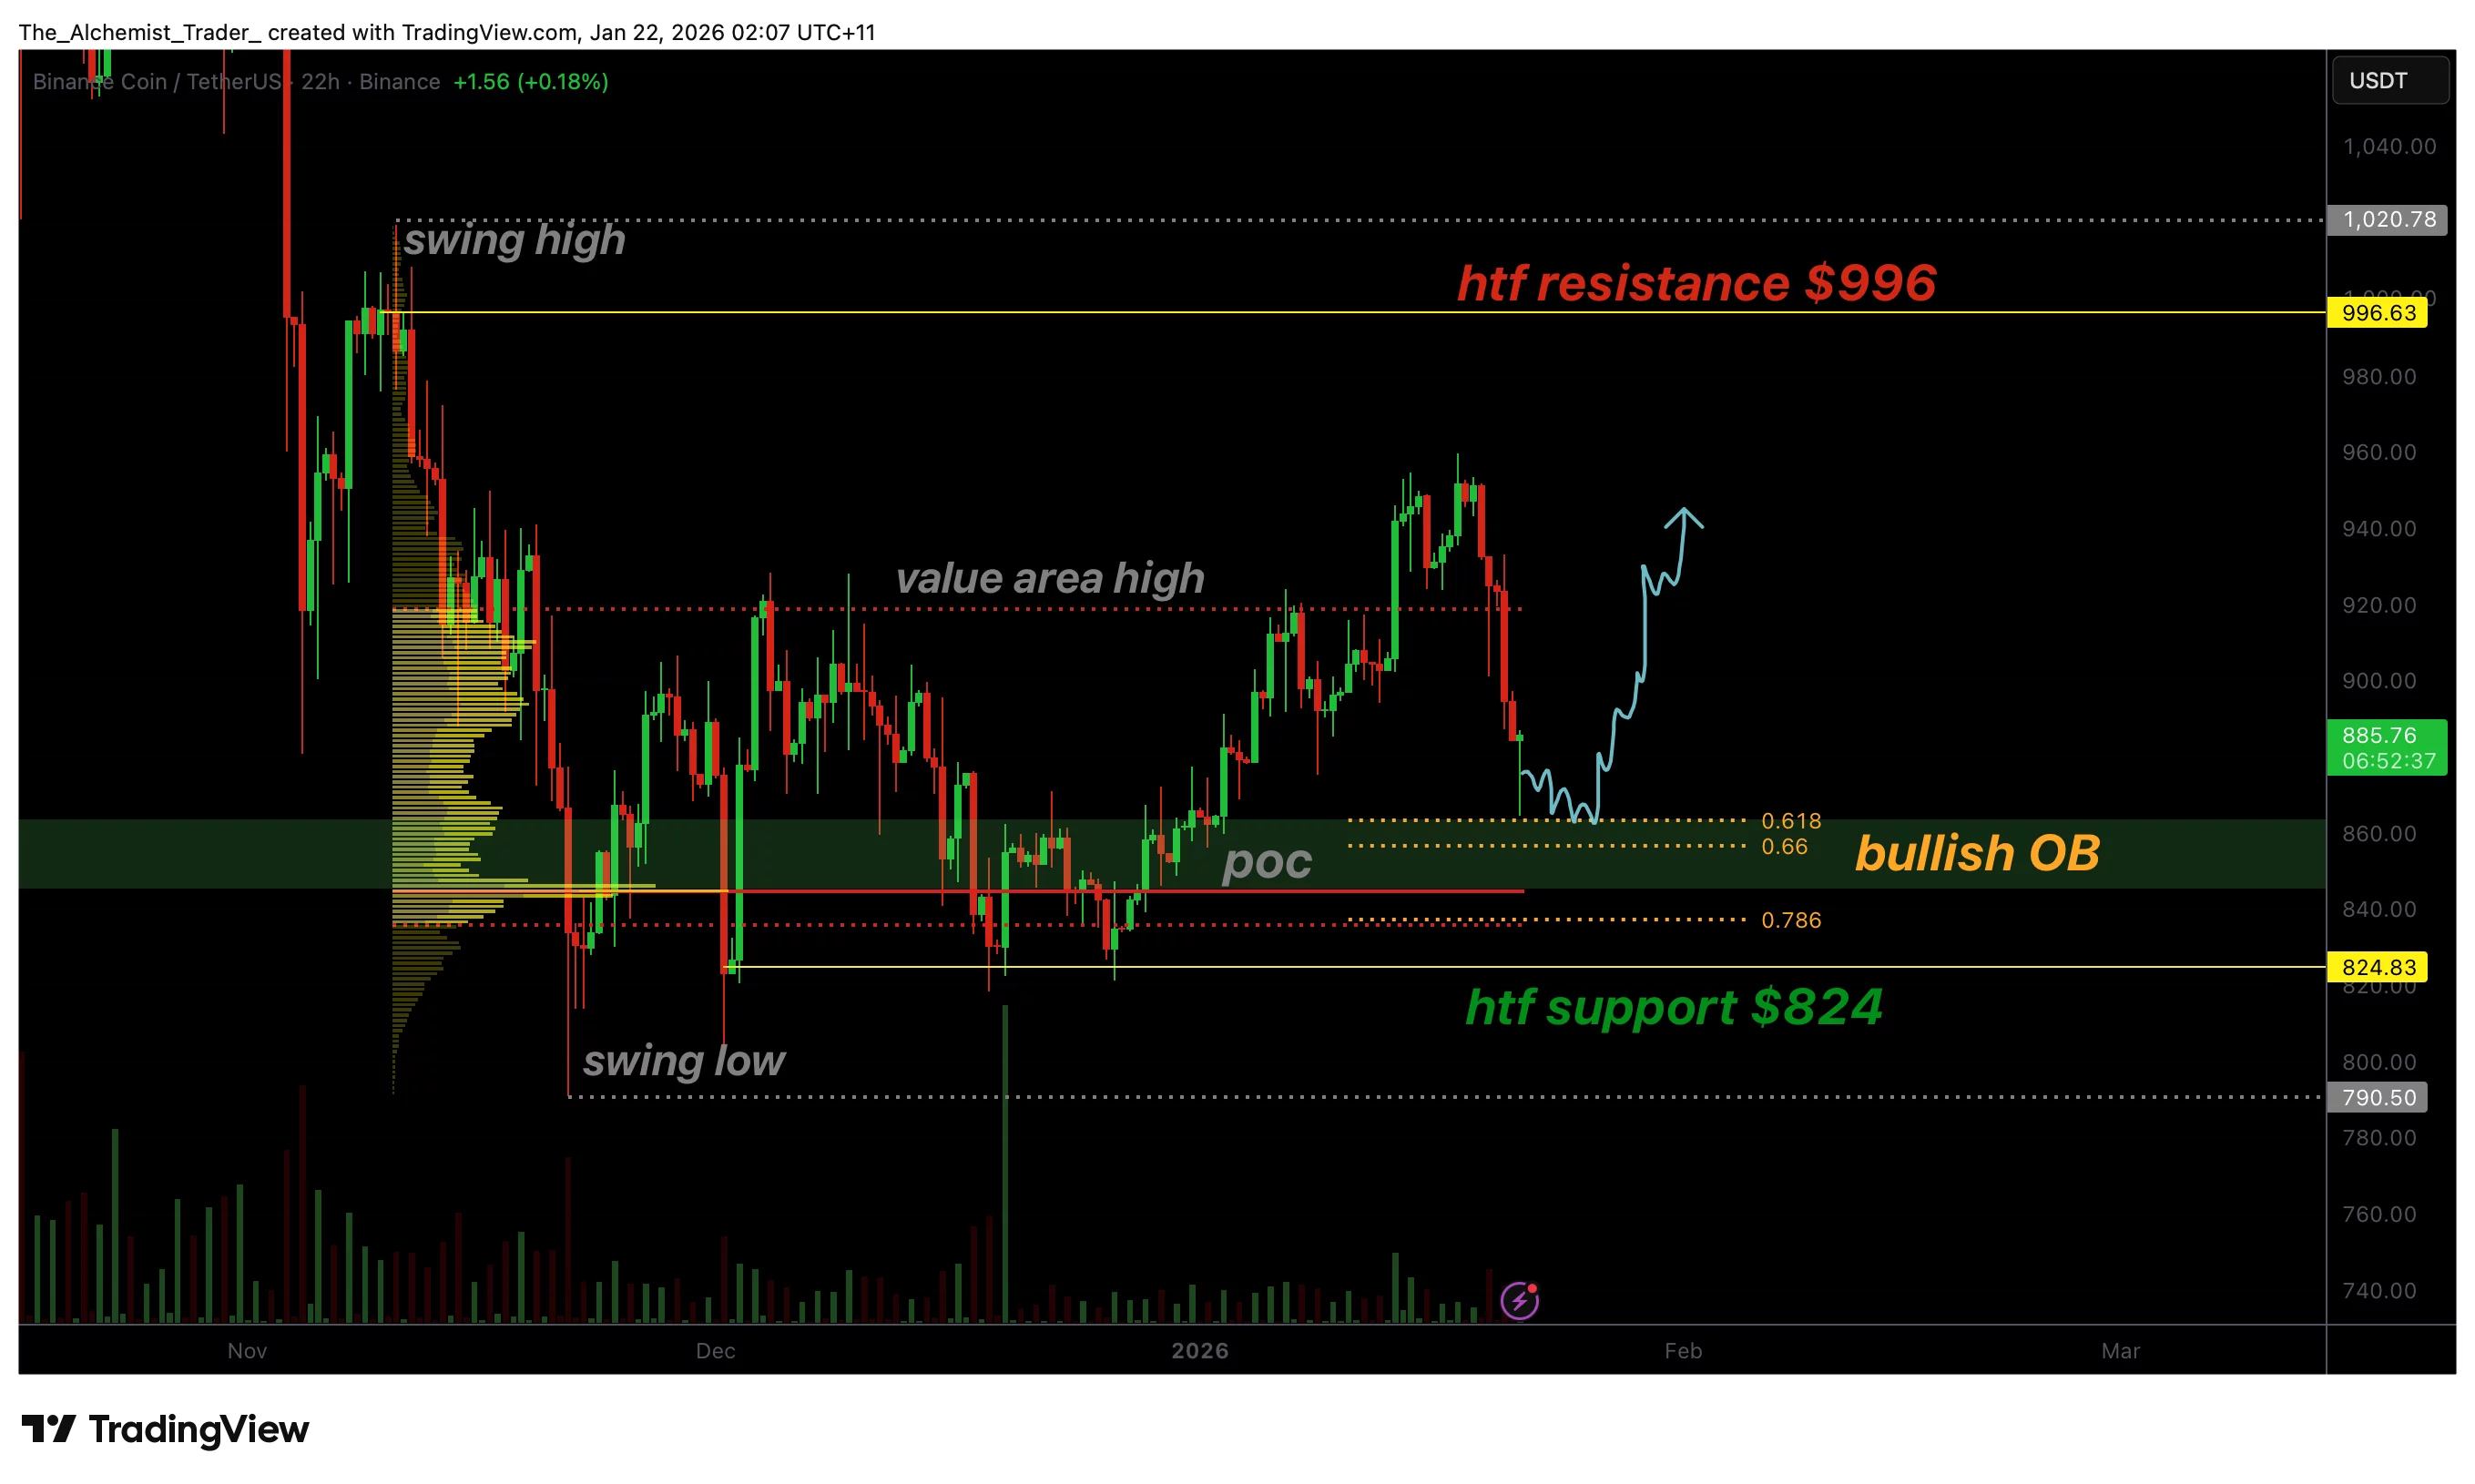
BNB price is reacting from a high-confluence bullish order block near $840–$860, with the 0.618 Fibonacci and point of control aligning as support while upside targets rebuild.
- BNB is reacting from a bullish order block with strong confluence
- 0.618 Fib + POC align as key support around $840–$860
- Holding support opens upside rotation toward VAH and $996 resistance
BNB (BNB) price has seen elevated volatility in recent sessions, but the latest corrective move has brought the price into a technically important demand zone. Binance Coin is now trading inside a bullish order block that aligns with multiple confluence factors, including the 0.618 Fibonacci retracement and the point of control (POC).
When a market rotates into this type of support cluster, the probability of a reaction increases, especially if buyers step in aggressively and defend the level on higher time frames.
BNB price key technical points
- BNB corrected into a bullish order block with strong confluence support
- 0.618 Fibonacci + Point of Control align near $840–$860
- Holding support opens a rotation toward $996, but VAH reclaim is key
Order blocks often represent areas where strong buying previously entered the market, creating a zone of demand that can act as support during pullbacks. In BNB’s case, the corrective move has returned price to a bullish order block region where buyers are expected to defend.
What makes this level even more significant is the confluence surrounding it. The order block is not acting alone, it is reinforced by the 0.618 Fibonacci retracement and the Point of Control, which increases the probability that this area acts as a meaningful pivot. When multiple technical signals overlap, it often attracts increased participation from traders looking for a high-probability reaction.
This is exactly what BNB is currently showing: a developing bounce attempt that suggests demand is stepping in and slowing the corrective move.
Why the 0.618 Fibonacci and POC confluence matters
The 0.618 Fibonacci retracement is one of the most widely respected technical levels in market structure trading. It often acts as a decision point between continuation and breakdown, making it a critical level for trend health.
The point of control, on the other hand, represents the market’s most traded price zone and acts as a key “fair value” level. When price trades around the POC, markets tend to rebalance and rotate. Holding above it can signal bullish stability, while failing to reclaim it can indicate weakness.
In BNB’s current setup, both the 0.618 and POC are aligned inside the bullish order block. This creates a strong support cluster where buyers have a strong technical justification to step in, which is why this region holds high importance for directional continuation.
Upside targets: $996 and the value area high
If BNB holds above the $840–$860 support region and establishes a higher low, it opens the probability for a rotational move back toward high-time-frame resistance near $996. This target becomes relevant because it represents a major structural resistance zone where sellers are likely to respond.
However, before BNB can realistically push toward $996, the market must reclaim the Value Area High (VAH). The VAH serves as an upper bound on accepted values. Reclaiming it on a closing basis is essential for bullish continuation because it signals that the market is accepting higher value and shifting strength back toward buyers.
Without a VAH reclaim, any bounce remains vulnerable to rejection and may stay confined to a corrective move rather than transitioning into a sustained trend continuation.
What would invalidate the reversal attempt?
While the bullish setup is developing, the key invalidation remains a breakdown below the order block region. If BNB loses the $840–$860 support cluster on a closing basis and fails to quickly reclaim it, it would signal that demand is not strong enough to hold the structure.
In that scenario, the corrective move would likely continue lower and the reversal narrative would weaken significantly. That is why the current zone is a pivotal inflection point; BNB is either building a base for continuation or failing support and confirming deeper downside risk.
What to expect in the coming price action
BNB is currently trading at a key technical support region around $840–$860, where a bullish order block aligns with the 0.618 Fibonacci and the Point of Control. Early wick rejection signals that buyers are stepping in, but confirmation will depend on sustained closes above support and improving momentum.
If BNB continues to close above the order block and reclaims the Value Area High, the probability of a rotation toward $996, the high-time-frame resistance, increases. If support fails, downside continuation becomes the dominant scenario.


You May Also Like

BSP ‘considering’ off-cycle rate hike as inflation risks worsen

Bitcoin Bull Michael Saylor Cited Two Reasons Why Bitcoin Isn’t Rallying

Solana treasury firm Solmate raises $11.4M in premium stock offering


