Bitcoin Breaks Key Support Level That Confirmed the 2022 Bear Market: CryptoQuant
Bitcoin’s momentum has weakened sharply this week, breaking below a key support zone that historically marked the transition from bull markets to bear phases.
After months of consolidation above the six-figure threshold, Bitcoin slipped under $100,000, raising fears that a deeper correction could unfold if price recovery fails to materialize soon.
According to CryptoQuant’s Bull Score Index, market sentiment has turned extremely bearish, dropping to zero for the first time since June 2022—a reading that previously coincided with the onset of the last major bear market.
As macro conditions tighten and on-chain indicators soften, traders are watching key support levels closely to determine whether this pullback is a temporary correction or the beginning of a prolonged downtrend.
Bitcoin Falls Below the 365-Day Moving Average
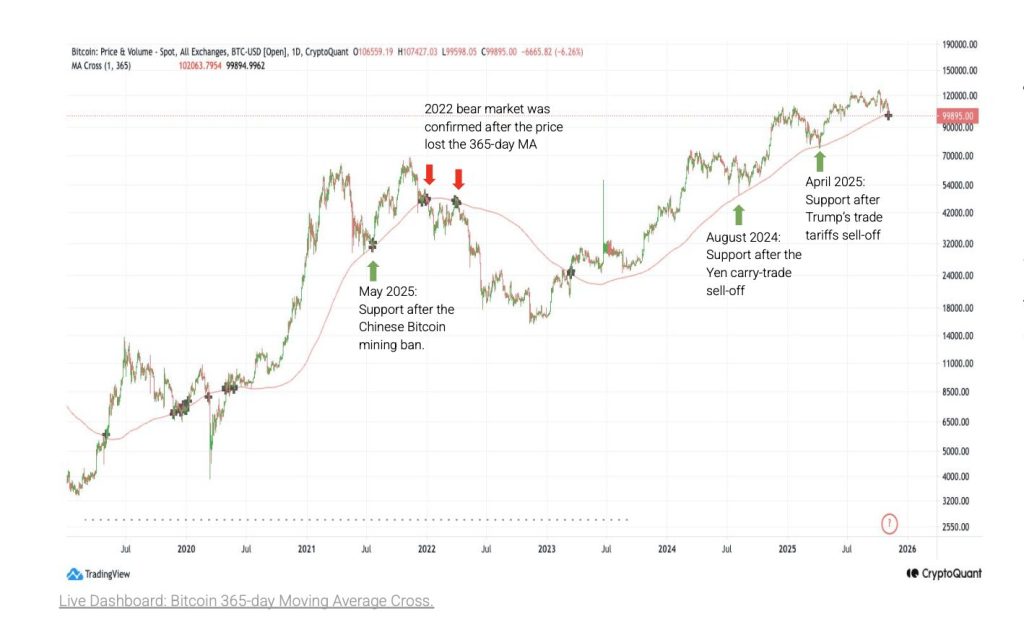
The most alarming technical development is Bitcoin’s fall below its 365-day moving average (MA), currently around $102,000. This long-term indicator has served as a key line of defense throughout the current cycle, acting as both technical and psychological support.
Historically, when Bitcoin broke decisively below its 365-day MA—most notably in December 2021 to January 2022—it indicated the formal start of a bear market.
Unless Bitcoin reclaims this level quickly, analysts warn of a potential acceleration in selling pressure, with momentum traders and algorithms likely to amplify downside volatility.
On-chain Data Points to Possible Drop Toward $72K
The Traders’ On-chain Realized Price Bands also point to an elevated risk of further downside. These bands, which track average acquisition prices for short-term holders, indicate a lower band near $100K and a minimum band around $72K.
If Bitcoin remains below the $100K threshold for long, traders realizing losses could push prices toward that $72K support, marking a 28% drawdown from current levels.
So far this cycle, the lower band has acted as a dynamic support, cushioning retracements as weaker hands capitulate. A breakdown below this range would mark a structural shift in trader behavior, mirroring patterns last seen in 2022.
Network Valuation Support Near $91K
Under the network valuation model based on Metcalfe’s law—which states a network’s value grows proportionally to the square of its user base—Bitcoin’s next key support lies around $91,000, corresponding to the 2x Metcalfe-Value band.
Bitcoin traded near this valuation from November 2024 through May 2025, and a retest could stabilize the market temporarily if investor participation remains steady.
With fundamentals weakening and confidence slipping, Bitcoin is again testing that “red thin line” between a deep correction and a renewed rally—echoing the precarious dynamics that defined the 2022 bear market.


You May Also Like

Hard luck lands J-6er before tough Trump judge

Dartmouth Endowment Adopts Solana ETF, Reaches $14M Crypto Exposure