Quant (QNT) Price Prediction 2026, 2027-2030
- Bullish QNT price prediction for 2026 is $89.19 to $135.27.
- Quant (QNT) price might reach $300 soon.
- Bearish QNT price prediction for 2026 is $41.47.
In this Quant (QNT) price prediction 2026, 2027-2030, we will analyze the price patterns of QNT by using accurate trader-friendly technical analysis indicators and predict the future movement of the cryptocurrency.
|
TABLE OF CONTENTS
|
|
INTRODUCTION
|
|
|
QUANT (QNT) PRICE PREDICTION 2026
|
|
| QUANT (QNT) PRICE PREDICTION 2027, 2028-2030 |
| CONCLUSION |
| FAQ |
Quant (QNT) Current Market Status
| Current Price | $84.66 |
| 24 – Hour Price Change | 14.79% Up |
| 24 – Hour Trading Volume | $33.82M |
| Market Cap | $1.02B |
| Circulating Supply | 12.07M QNT |
| All – Time High | $428.38 (Sep 11, 2021) |
| All – Time Low | $0.1636 (Aug 23, 2018 ) |
What is Quant (QNT)?
| TICKER | QNT |
| BLOCKCHAIN | Ethereum |
| CATEGORY | ERC-20 |
| LAUNCHED ON | June 2018 |
| UTILITIES | Payments staking, locking, and licensing fees. |
Quant (QNT) is the native token of the Quant Network, launched as an ERC-20 token in 2018. It powers the network’s Ethereum-based distributed ledger technology (DLT) operating system, Overledger.
Overledger Network is the unique feature of the Quant Network. It serves as a blockchain-based API gateway that facilitates the creation and execution of decentralized multi-chain apps (mDApps). The technology went live on Quant Network in September 2021.
The Overledger connects different private blockchains to public blockchains such as Ethereum, Polkadot, and Polygon. It focuses on enhancing the security and interoperability between several blockchains.
Quant (QNT) is deployed in primary use cases. It is used as a payment fee to access services on the Quant Network. It is deployed as license fees by the network’s treasury system to credit its gateway operators.
Quant 24H Technicals
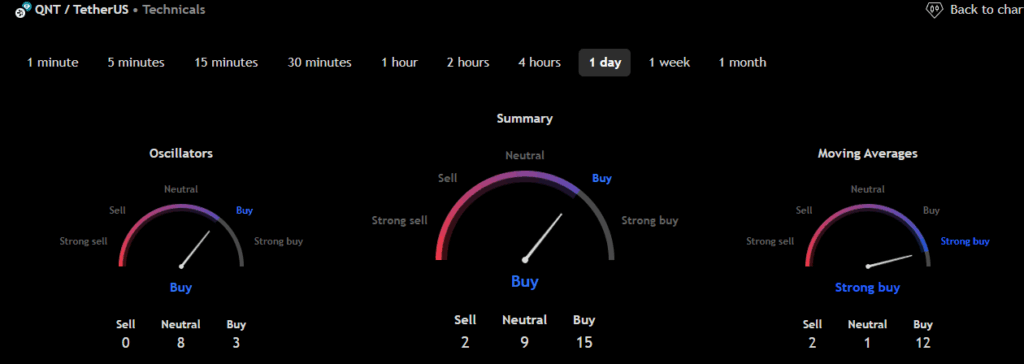 (Source: TradingView)
Quant (QNT) Price Prediction 2026
Quant (QNT) ranks 69th on CoinMarketCap in terms of its market capitalization. The overview of the Quant price prediction for 2026 is explained below with a daily time frame.
In the above chart, Quant (QNT) laid out an Horizontal channel pattern. The Horizontal channel pattern is also known as the sideways trend. In general, the horizontal channel is formed during the price consolidation. In this pattern, the upper trendline, the line that connects the highs, and the lower trendline, the line that connects the lows, run horizontally parallel, and the price action is contained within it.
A horizontal channel is often regarded as one of the suitable patterns for timing the market, as the buying and selling points are in consolidation.
At the time of analysis, the price of Quant (QNT) was recorded at $84.66. If the pattern trend continues, then the price of QNT might reach the resistance levels of $86.64, $107.84 and $166.23. If the trend reverses, then the price of QNT may fall to the support levels $69.61.
Quant (QNT) Resistance and Support Levels
The chart given below elucidates the possible resistance and support levels of Quant (QNT) in 2026.
From the above chart, we can analyze and identify the following as the resistance and support levels of Quant (QNT) for 2026.
| Resistance Level 1 | $89.19 |
| Resistance Level 2 | $135.27 |
| Support Level 1 | $59.98 |
| Support Level 2 | $41.47 |
QNT Resistance & Support Levels
Quant (QNT) Price Prediction 2026 — RVOL, MA, and RSI
The technical analysis indicators such as Relative Volume (RVOL), Moving Average (MA), and Relative Strength Index (RSI) of Quant (QNT) are shown in the chart below.
From the readings on the chart above, we can make the following inferences regarding the current Quant (QNT) market in 2026.
| INDICATOR | PURPOSE | READING | INFERENCE |
| 50-Day Moving Average (50MA) | Nature of the current trend by comparing the average price over 50 days | 50 MA = $79.88Price = $80.53 (50MA < Price) |
Bullish/Uptrend |
| Relative Strength Index (RSI) | Magnitude of price change;Analyzing oversold & overbought conditions | 57.01 <30 = Oversold 50-70 = Neutral>70 = Overbought |
Neutral |
| Relative Volume (RVOL) | Asset’s trading volume in relation to its recent average volumes | Below cutoff line | Weak volume |
Quant (QNT) Price Prediction 2026 — ADX, RVI
In the below chart, we analyze the strength and volatility of Quant (QNT) using the following technical analysis indicators – Average Directional Index (ADX) and Relative Volatility Index (RVI).
From the readings on the chart above, we can make the following inferences regarding the price momentum of Quant (QNT).
| INDICATOR | PURPOSE | READING | INFERENCE |
| Average Directional Index (ADX) | Strength of the trend momentum | 10.08 | Weak Trend |
| Relative Volatility Index (RVI) | Volatility over a specific period | 53.83 <50 = Low >50 = High |
High Volatility |
Comparison of QNT with BTC, ETH
Let us now compare the price movements of Quant (QNT) with that of Bitcoin (BTC), and Ethereum (ETH).
From the above chart, we can interpret that the price action of QNT is similar to that of BTC and ETH. That is, when the price of BTC and ETH increases or decreases, the price of QNT also increases or decreases respectively.
Quant (QNT) Price Prediction 2027, 2028 – 2030
With the help of the aforementioned technical analysis indicators and trend patterns, let us predict the price of Quant (QNT) between 2027, 2028, 2029, and 2030.
| Year | Bullish Price | Bearish Price |
| Quant (QNT) Price Prediction 2027 | $260 | $40 |
| Quant (QNT) Price Prediction 2028 | $270 | $35 |
| Quant (QNT) Price Prediction 2029 | $280 | $30 |
| Quant (QNT) Price Prediction 2030 | $290 | $25 |
Conclusion
If Quant (QNT) establishes itself as a good investment in 2026, this year will be favorable to the cryptocurrency. In conclusion, the bullish Quant (QNT) price prediction for 2026 is $135.27. Comparatively, the bearish Quant (QNT) price prediction for 2026 is $41.47.
If there is a positive elevation in the market momentum and investors’ sentiment, then Quant (QNT) might hit $300. Furthermore, with future upgrades and advancements in the Quant ecosystem, QNT might surpass its current all-time high (ATH) of $428.38 and mark its new ATH.
FAQ
1. What is Quant (QNT)?
Quant (QNT) is the native token of the Quant Network. Quant Network is an operating system based on distributed ledger technology (DLT). It confers universal interoperability via its Overledger Network and multi-chain smart contracts. QNT was launched in an ICO in 2018.
2. Where can you buy Quant (QNT)?
Traders can trade Quant (QNT) on the following cryptocurrency exchanges such as Binance, Deepcoin, Bitget, Bitrue, and BingX.
3. Will Quant (QNT) record a new ATH soon?
With the ongoing developments and upgrades within the Quant platform, Quant (QNT) has a high possibility of reaching its ATH soon.
4. What is the current all-time high (ATH) of Quant (QNT)?
Quant (QNT) hit its current all-time high (ATH) of $428.38 on September 11, 2021.
5. What is the lowest price of Quant (QNT)?
According to CoinMarketCap, QNT hit its all-time low (ATL) of $0.1636 on Aug 23, 2018.
6. Will Quant (QNT) hit $300?
If Quant (QNT) becomes one of the active cryptocurrencies that majorly maintain a bullish trend, it might rally to hit $300 soon.
7. What will be the Quant (QNT) price by 2027?
Quant (QNT) price might reach $360 by 2027
8. What will be the Quant (QNT) price by 2028?
Quant (QNT) price might reach $370 by 2028.
9. What will be the Quant (QNT) price by 2029?
Quant (QNT) price might reach $380 by 2029.
10. What will be the Quant (QNT) price by 2030?
Quant (QNT) price might reach $390 by 2030..
Top Crypto Predictions
Avalanche (AVAX) Price Prediction
Official Trump (TRUMP) Price Prediction
Sui (SUI) Price Prediction
Disclaimer: The opinion expressed in this chart is solely the author’s. It does not represent any investment advice. TheNewsCrypto team encourages all to do their own research before investing.


You May Also Like

Spot CVD Chart Reveals Critical Bitcoin Support Levels as Institutional Orders Surge on April 2

Fed Day Dry Powder: Cryptoquant Analyst Tracks $7.6B Stablecoin Pile on Exchanges