Crypto market researcher Dom (@traderview2) says he’s identified what looks like a persistent, algorithmic XRP seller on South Korea’s Upbit: one that, by his estimatesCrypto market researcher Dom (@traderview2) says he’s identified what looks like a persistent, algorithmic XRP seller on South Korea’s Upbit: one that, by his estimates

This Korean XRP Exchange Data Has The Community Losing It

2026/02/18 16:00
5 min read
For feedback or concerns regarding this content, please contact us at crypto.news@mexc.com

Crypto market researcher Dom (@traderview2) says he’s identified what looks like a persistent, algorithmic XRP seller on South Korea’s Upbit: one that, by his estimates, has offloaded roughly 3.3 billion XRP into the XRP/KRW order book over the past 10 months. If the analysis holds, it reframes Upbit’s XRP flow as a venue-specific phenomenon rather than a simple reflection of global risk-on/risk-off sentiment.

XRP/KRW Saw $5 Billion in Net Selling

Dom analyzed “82 million trades on Upbit XRP/KRW” and mapped their net imbalance over time. His headline conclusion: “A $5 billion one directional selling pipeline running 24/7 for almost a year.”

Dom said the work began after an intense intraday stretch that forced a closer look at the tape. “It started with yesterday’s price action. -57M XRP in CVD over 17 hours. It looked insane,” he wrote. “So I ran forensic queries – bot fingerprinting, iceberg detection, wash trade checks. The selling was real. Algorithmic. 61% of trades fired within 10ms. Single bot running 17 hours straight with one 33 second pause.”

Instead of treating that -57 million XRP cumulative volume delta as an outlier, Dom said he zoomed out and found it matched a longer-running pattern. “-57M isn’t an anomaly,” he wrote. “Upbit XRP/KRW has been net negative every single month for 10 months,” listing several months with large net selling: “Apr: -165M,” “Jul: -197M,” “Oct: -382M,” and “Jan: -370M.” In total, he put the figure at “3.3 BILLION XRP in net selling. ~$5B.”

He also argued the flow is unusually consistent. “Only 1 week out of 46 was positive. One,” Dom wrote, adding that there is “no weekday/weekend distinction” and “no time of day where buying outweighs selling in aggregate.” That persistence is part of why he framed it as something closer to execution infrastructure than discretionary trading. “This isn’t a trader,” he wrote. “It’s infrastructure.”

A key part of the thread is the cross-venue comparison. Dom said Binance’s XRP/USDT market showed materially less sell pressure during the same windows—“2-5x less sell pressure on the same coin,” he wrote, pointing to a June period where “Binance was net positive while Upbit bled -218M.”

He also flagged a weak relationship between the two venues’ hour-by-hour flow, claiming “the hourly correlation between the two venues is only 0.37,” which would imply Upbit’s net selling is being driven by local factors rather than simply mirroring global positioning.

XRP Traded Cheaper In Korea For Months

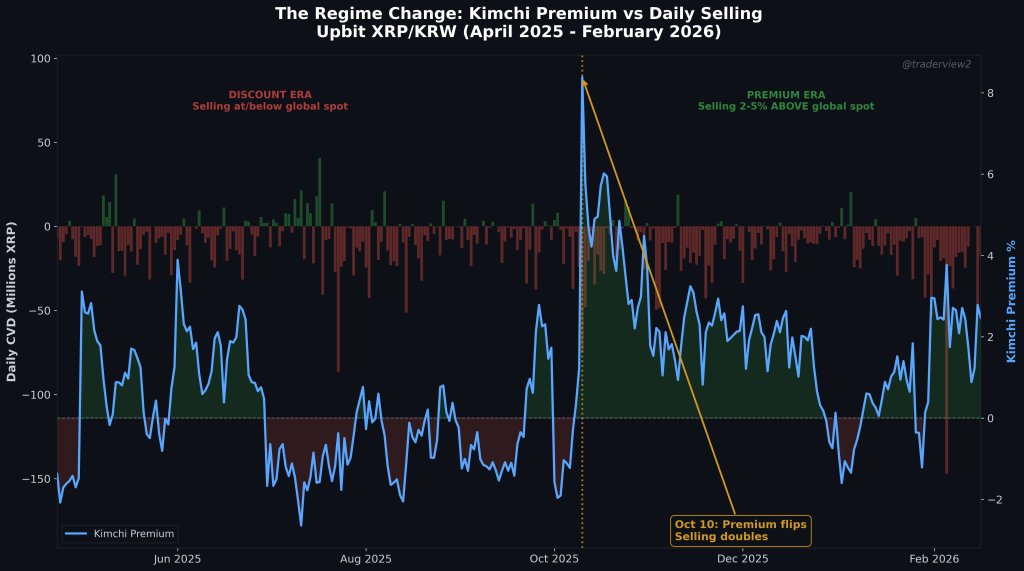
Dom’s pricing observations added another layer. He said that from April through September, Upbit XRP traded “3-6% BELOW Binance,” calling it a “reverse Kimchi discount.” In his view, that detail matters because it suggests the seller was willing to accept consistently worse execution than what was available elsewhere.

“The sellers were accepting 6% worse fills than available on global markets, for many months,” Dom wrote. “They don’t care about the price. They need KRW, are mandated to use Upbit, and/or are Korean holders taking profit…”

He then pointed to what he described as a structural break around Oct. 10. “Korean retail went insane. Premium flipped from -0.07% to +2.4% in a single day. Trades 5x’d to 832K,” Dom wrote, adding that the premium “has only briefly gone negative since.” The seller, in his telling, did not back off—if anything, the pace increased. “And the sellers? They doubled their daily rate. From -6.3M/day to -11.2M/day.”

The Kimchi Discount

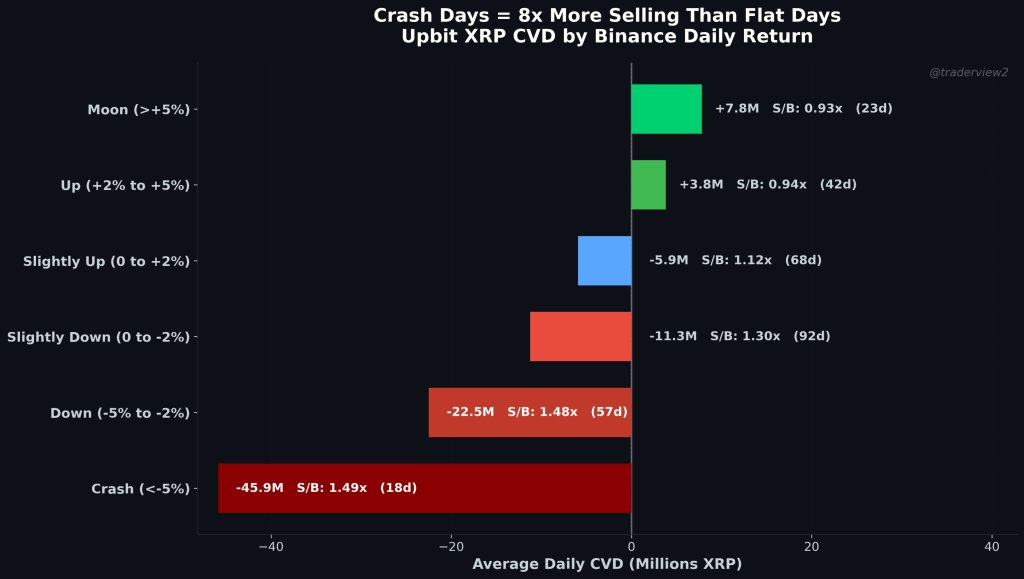
Dom tried to connect that behavior to market regimes by “bucket[ing] every day by what XRP did on Binance globally,” reporting that Upbit flow skews heavily negative on down days and especially on crash days.

He summarized the dynamic as feedback between a systematic seller and retail behavior: “On moon days, Korean retail becomes a NET BUYER. They’re accumulating,” he wrote. “On crash days, sell intensity is 8x heavier. The systematic seller + retail panic amplify each other. Korean retail buys every rip. The pipeline sells into all of it.”

XRP selling pressure on crash days

To support the “machine versus retail” framing, Dom contrasted order-size fingerprints on both sides of the tape. He claimed the sell side repeatedly used round-number clips—“10, 50, 100, 500, 1000 XRP”—with “57-60% of all trades fire within 10ms,” while the buy side showed a large fraction of “tiny fractional sizes,” such as “2.535, 3.679, 2.681 XRP,” which he argued is consistent with KRW-denominated retail tickets like buying a fixed won amount of XRP. “One side looks like retail,” he wrote. “The other looks like a machine.”

The scale claim is also central to why the thread traveled. Dom said “3.3 billion XRP” represents “5.4% of XRP’s entire circulating supply,” moved through “a single trading pair, on a single exchange, in 10 months.” He emphasized he’s working from trade-level datasets: “This analysis used tick trade data I collected from Upbit and Binance,” he wrote, citing “82M Upbit trades + 444M Binance trades.”

Dom stopped short of naming a specific entity behind the selling, instead posing a question he framed as the next investigative step: who can sustain “300-400M per month for a year straight,” seemingly “doesn’t care about 6% discounts,” and “needs KRW specifically or is in some walled garden and can only use Upbit?”

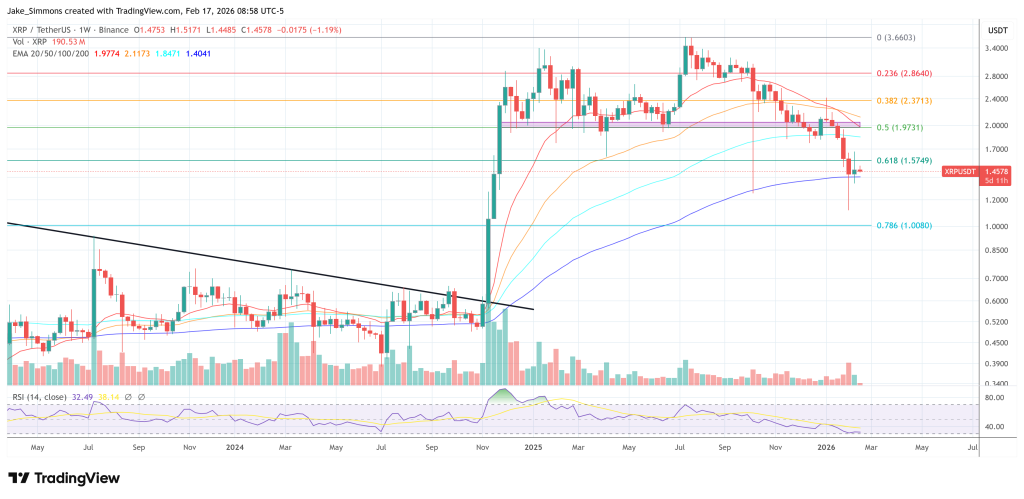
At press time, XRP traded at $1.45.

XRP price chart
Disclaimer: The articles reposted on this site are sourced from public platforms and are provided for informational purposes only. They do not necessarily reflect the views of MEXC. All rights remain with the original authors. If you believe any content infringes on third-party rights, please contact crypto.news@mexc.com for removal. MEXC makes no guarantees regarding the accuracy, completeness, or timeliness of the content and is not responsible for any actions taken based on the information provided. The content does not constitute financial, legal, or other professional advice, nor should it be considered a recommendation or endorsement by MEXC.

You May Also Like

Crucial US Stock Market Update: What Wednesday’s Mixed Close Reveals

Crucial US Stock Market Update: What Wednesday’s Mixed Close Reveals

BitcoinWorld Crucial US Stock Market Update: What Wednesday’s Mixed Close Reveals The financial world often keeps us on our toes, and Wednesday was no exception. Investors watched closely as the US stock market concluded the day with a mixed performance across its major indexes. This snapshot offers a crucial glimpse into current investor sentiment and economic undercurrents, prompting many to ask: what exactly happened? Understanding the Latest US Stock Market Movements On Wednesday, the closing bell brought a varied picture for the US stock market. While some indexes celebrated gains, others registered slight declines, creating a truly mixed bag for investors. The Dow Jones Industrial Average showed resilience, climbing by a notable 0.57%. This positive movement suggests strength in some of the larger, more established companies. Conversely, the S&P 500, a broader benchmark often seen as a barometer for the overall market, experienced a modest dip of 0.1%. The technology-heavy Nasdaq Composite also saw a slight retreat, sliding by 0.33%. This particular index often reflects investor sentiment towards growth stocks and the tech sector. These divergent outcomes highlight the complex dynamics currently at play within the American economy. It’s not simply a matter of “up” or “down” for the entire US stock market; rather, it’s a nuanced landscape where different sectors and company types are responding to unique pressures and opportunities. Why Did the US Stock Market See Mixed Results? When the US stock market delivers a mixed performance, it often points to a tug-of-war between various economic factors. Several elements could have contributed to Wednesday’s varied closings. For instance, positive corporate earnings reports from certain industries might have bolstered the Dow. At the same time, concerns over inflation, interest rate policies by the Federal Reserve, or even global economic uncertainties could have pressured growth stocks, affecting the S&P 500 and Nasdaq. Key considerations often include: Economic Data: Recent reports on employment, manufacturing, or consumer spending can sway market sentiment. Corporate Announcements: Strong or weak earnings forecasts from influential companies can significantly impact their respective sectors. Interest Rate Expectations: The prospect of higher or lower interest rates directly influences borrowing costs for businesses and consumer spending, affecting future profitability. Geopolitical Events: Global tensions or trade policies can introduce uncertainty, causing investors to become more cautious. Understanding these underlying drivers is crucial for anyone trying to make sense of daily market fluctuations in the US stock market. Navigating Volatility in the US Stock Market A mixed close, while not a dramatic downturn, serves as a reminder that market volatility is a constant companion for investors. For those involved in the US stock market, particularly individuals managing their portfolios, these days underscore the importance of a well-thought-out strategy. It’s important not to react impulsively to daily movements. Instead, consider these actionable insights: Diversification: Spreading investments across different sectors and asset classes can help mitigate risk when one area underperforms. Long-Term Perspective: Focusing on long-term financial goals rather than short-term gains can help weather daily market swings. Stay Informed: Keeping abreast of economic news and company fundamentals provides context for market behavior. Consult Experts: Financial advisors can offer personalized guidance based on individual risk tolerance and objectives. Even small movements in major indexes can signal shifts that require attention, guiding future investment decisions within the dynamic US stock market. What’s Next for the US Stock Market? Looking ahead, investors will be keenly watching for further economic indicators and corporate announcements to gauge the direction of the US stock market. Upcoming inflation data, statements from the Federal Reserve, and quarterly earnings reports will likely provide more clarity. The interplay of these factors will continue to shape investor confidence and, consequently, the performance of the Dow, S&P 500, and Nasdaq. Remaining informed and adaptive will be key to understanding the market’s trajectory. Conclusion: Wednesday’s mixed close in the US stock market highlights the intricate balance of forces influencing financial markets. While the Dow showed strength, the S&P 500 and Nasdaq experienced slight declines, reflecting a nuanced economic landscape. This reminds us that understanding the ‘why’ behind these movements is as important as the movements themselves. As always, a thoughtful, informed approach remains the best strategy for navigating the complexities of the market. Frequently Asked Questions (FAQs) Q1: What does a “mixed close” mean for the US stock market? A1: A mixed close indicates that while some major stock indexes advanced, others declined. It suggests that different sectors or types of companies within the US stock market are experiencing varying influences, rather than a uniform market movement. Q2: Which major indexes were affected on Wednesday? A2: On Wednesday, the Dow Jones Industrial Average gained 0.57%, while the S&P 500 edged down 0.1%, and the Nasdaq Composite slid 0.33%, illustrating the mixed performance across the US stock market. Q3: What factors contribute to a mixed stock market performance? A3: Mixed performances in the US stock market can be influenced by various factors, including specific corporate earnings, economic data releases, shifts in interest rate expectations, and broader geopolitical events that affect different market segments uniquely. Q4: How should investors react to mixed market signals? A4: Investors are generally advised to maintain a long-term perspective, diversify their portfolios, stay informed about economic news, and avoid impulsive decisions. Consulting a financial advisor can also provide personalized guidance for navigating the US stock market. Q5: What indicators should investors watch for future US stock market trends? A5: Key indicators to watch include upcoming inflation reports, statements from the Federal Reserve regarding monetary policy, and quarterly corporate earnings reports. These will offer insights into the future direction of the US stock market. Did you find this analysis of the US stock market helpful? Share this article with your network on social media to help others understand the nuances of current financial trends! To learn more about the latest stock market trends, explore our article on key developments shaping the US stock market‘s future performance. This post Crucial US Stock Market Update: What Wednesday’s Mixed Close Reveals first appeared on BitcoinWorld.
Share
Coinstats2025/09/18 05:30
TRX Price Prediction: Testing $0.32-$0.35 Resistance Zone as Technical Momentum Builds

TRX Price Prediction: Testing $0.32-$0.35 Resistance Zone as Technical Momentum Builds

TRON (TRX) consolidates at $0.28 with neutral RSI signals. Technical analysis suggests potential breakout toward $0.32-$0.35 resistance zone amid mixed momentum
Share
BlockChain News2026/03/04 15:57
Pi Network DEX Launch Confirmed for March 12, 2026: A New Chapter for Picoin and Web3 Trading

Pi Network DEX Launch Confirmed for March 12, 2026: A New Chapter for Picoin and Web3 Trading

    Pi Network has officially confirmed the launch date of its decentralized exchange (DEX), scheduled for Marc
Share
Hokanews2026/03/04 15:52