AUD/USD Forecast: Bulls Defend Critical 200-Hour EMA and Fibonacci Confluence Below 0.7000
BitcoinWorld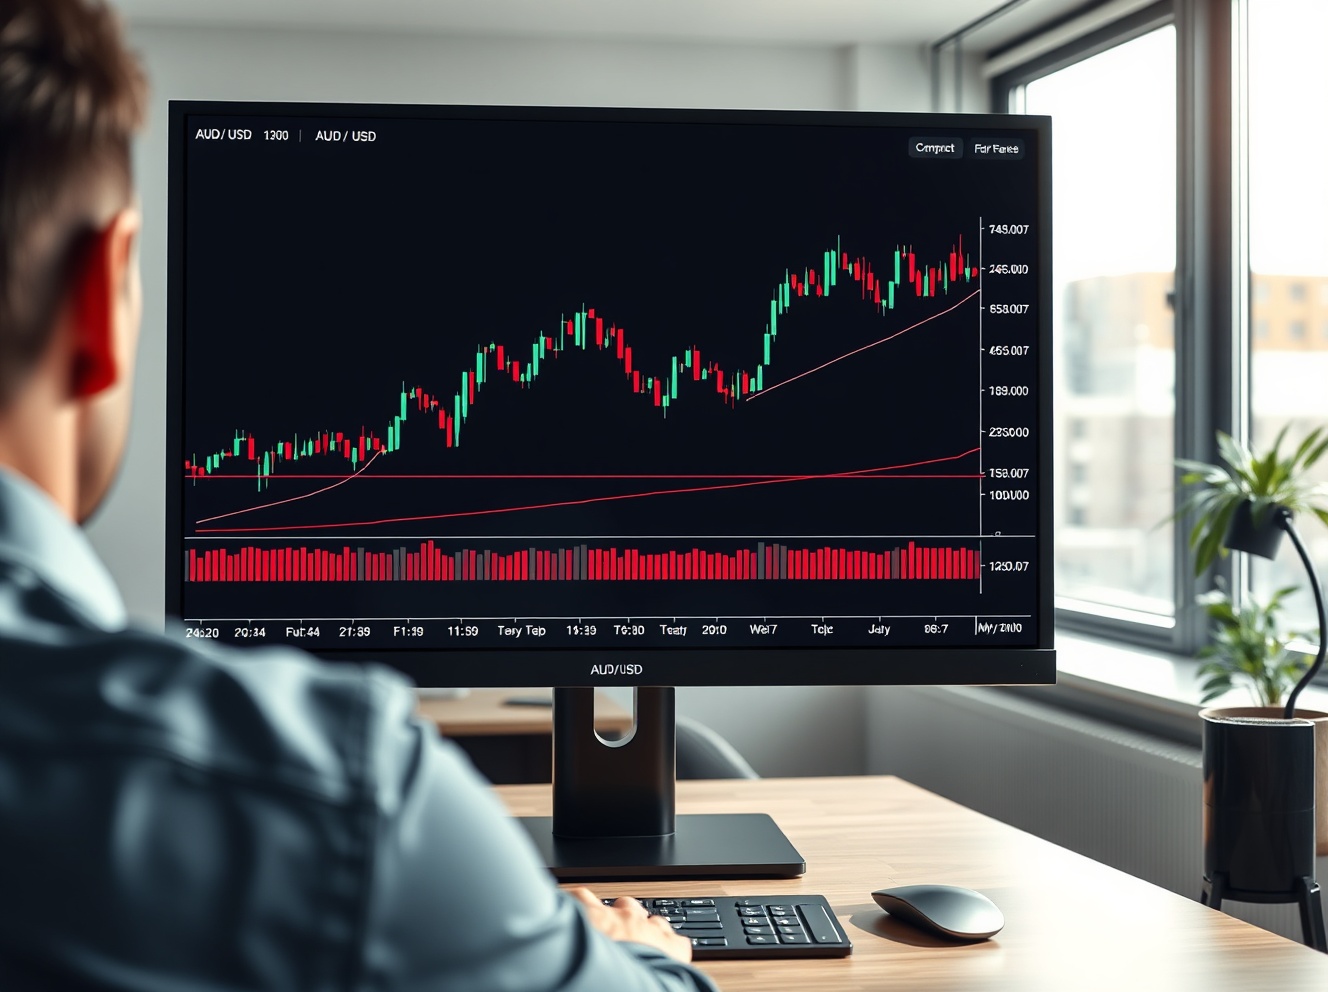
AUD/USD Forecast: Bulls Defend Critical 200-Hour EMA and Fibonacci Confluence Below 0.7000
The AUD/USD currency pair is currently engaged in a pivotal technical battle, defending a crucial confluence of support formed by the 200-hour Exponential Moving Average (EMA) and the 38.2% Fibonacci retracement level just below the significant psychological barrier of 0.7000. This defense, observed in global forex markets on Thursday, May 15, 2025, highlights a critical juncture for the Australian dollar’s near-term trajectory against the US dollar.
AUD/USD Technical Confluence: A Detailed Breakdown
Technical analysts closely monitor confluence zones where multiple indicators align. Currently, the AUD/USD finds support at a precise intersection. Firstly, the 200-hour EMA represents a widely watched short-to-medium-term trend indicator. Secondly, the 38.2% Fibonacci retracement level, drawn from a recent swing low to a swing high, acts as a common retracement support. The defense of this zone suggests underlying buying interest. A sustained break below, however, could trigger accelerated selling. Market participants use these levels to gauge momentum and set risk parameters.
The Mechanics of Key Technical Indicators
Understanding the tools at play is essential. The 200-hour EMA smooths out price data over the last 200 trading hours, highlighting the underlying trend direction. A price above it suggests bullish bias, while a break below signals potential bearish momentum. The Fibonacci retracement tool, based on mathematical ratios, identifies potential support and resistance levels after a price move. The 38.2% level is often the first major retracement support. The convergence of these two independent methods at the same price point strengthens its technical significance, creating a high-probability reaction zone for traders.
Fundamental Drivers Influencing the Australian Dollar
Beyond the charts, fundamental factors exert constant pressure. The Reserve Bank of Australia’s (RBA) monetary policy stance remains a primary driver. Recent meeting minutes and statements provide clues on future interest rate decisions, directly impacting currency valuation. Conversely, US Federal Reserve policy and US dollar strength form the other side of the equation. Commodity prices, particularly iron ore and coal, significantly influence Australia’s export-driven economy and, by extension, the AUD. Geopolitical tensions and global risk sentiment also play a role, as the AUD is often considered a risk-sensitive currency.
| Level | Type | Significance |
|---|---|---|
| 0.7050 | Resistance | Recent Swing High / Psychological |
| 0.7000 | Psychological | Major Round Number Barrier |
| 0.6950-0.6965 | Support Confluence | 200-Hour EMA & 38.2% Fibo. |
| 0.6900 | Support | Previous Low / Psychological |
Expert Analysis on Market Sentiment
Market strategists note that holding above the confluence support is technically constructive. Jane Wilson, Senior Currency Strategist at Global FX Insights, stated in a recent client note, “The defense of this technical pocket indicates that dip-buying interest persists for the Aussie. However, conviction remains low without a clear catalyst to push it back above 0.7050.” This sentiment reflects a cautious market awaiting clearer directional cues from macroeconomic data or central bank communications.
Historical Context and Price Action Implications
Historical price action around the 0.7000 handle provides additional context. This level has acted as a major pivot point for the pair over the past 18 months. A sustained breakout above it in late 2024 led to a significant rally, while failures have resulted in sharp declines. The current consolidation just below it is typical of market indecision at major technical thresholds. Traders often look for increased volume and volatility to confirm the next directional move. Monitoring order flow data around these levels can offer insights into institutional positioning.
Key factors to watch include:
- RBA Communication: Any shift in tone regarding inflation or growth.
- US Economic Particularly inflation (CPI) and employment figures.
- China’s Economic Health: As Australia’s largest trading partner.
- Risk Appetite: Measured by equity market performance and volatility indices.
The Path Forward: Bullish and Bearish Scenarios
A bullish scenario requires the pair to firmly hold the current support confluence and subsequently break above the 0.7000-0.7050 resistance zone. Such a move could target the next Fibonacci extension levels near 0.7150. The bearish scenario involves a daily close below the 200-hour EMA and the 38.2% Fibo, confirmed by a break of the 0.6900 support. This would likely target the 50% or 61.8% Fibonacci retracement levels, potentially reopening the path toward the 0.6800 region. Volume analysis on these breaks will be crucial for validating the move’s sustainability.
Conclusion
The AUD/USD forecast hinges on the pair’s ability to defend the critical technical confluence below 0.7000. The interplay between the 200-hour EMA and the 38.2% Fibonacci retracement level provides a clear framework for traders. While technical structure currently favors the bulls within this support zone, the ultimate direction will be determined by fundamental catalysts and broader market risk sentiment. Continuous monitoring of both price action at these key levels and incoming macroeconomic data is essential for assessing the Australian dollar’s next major move against the US dollar.
FAQs
Q1: What does the 200-hour EMA indicate for AUD/USD?
The 200-hour Exponential Moving Average acts as a dynamic support or resistance level, indicating the short-to-medium-term trend. A price above it suggests bullish momentum, while trading below it can signal bearish control.
Q2: Why is the 38.2% Fibonacci level significant?
The 38.2% retracement is a common Fibonacci ratio used by traders to identify potential support after an upward move or resistance after a downward move. It often represents the first major level where a counter-trend move may pause or reverse.
Q3: What fundamental factors most impact the AUD/USD pair?
The pair is primarily influenced by the interest rate differential between the RBA and the Fed, commodity prices (especially iron ore), economic data from Australia and China, and overall global market risk sentiment.
Q4: What happens if AUD/USD breaks below the current support confluence?
A confirmed break below the 200-hour EMA and 38.2% Fibo support, especially on a daily closing basis, could trigger further technical selling, potentially targeting the next support levels near 0.6900 and then 0.6800.
Q5: What would signal a stronger bullish reversal for AUD/USD?
A decisive break and daily close above the 0.7050 resistance level, accompanied by strong volume, would signal a bullish reversal, invalidating the current downtrend structure and opening the path toward higher targets.
This post AUD/USD Forecast: Bulls Defend Critical 200-Hour EMA and Fibonacci Confluence Below 0.7000 first appeared on BitcoinWorld.


You May Also Like

What To Look For When Evaluating Nonprofit Budgeting Software for Finance Teams: A Platform Comparison

The PewBeam effect: like Nigeria’s fintech gold rush, a worship AI boom is coming