AVAX Price Prediction: $15 Target Within 90 Days as Smart Money Diverges
Alvin Lang May 04, 2026 07:26
AVAX consolidates at $9.25 while institutional traders position 63.7% long versus retail's 57.9%, creating a 6-point divergence that typically precedes major breakouts. Technical setup points to 62...

Market Context: Avalanche at Critical Juncture
Avalanche trades in a tight consolidation around $9.25, up 2% daily as the market weighs conflicting signals. The recent price action reflects genuine uncertainty about direction, but beneath the surface, positioning data reveals a clear institutional bias that analysts at Blockchain.news identify as the key factor to watch.
The network's infrastructure momentum continues building despite choppy price action. Real adoption metrics show sustained DeFi activity and tokenization growth, creating fundamental support that wasn't present during previous correction cycles. This organic usage provides a floor that makes dramatic downside increasingly unlikely.
Current market structure suggests AVAX is compressing energy for the next major move, with multiple timeframes converging at decision points that will determine whether the token breaks higher or requires additional base-building.
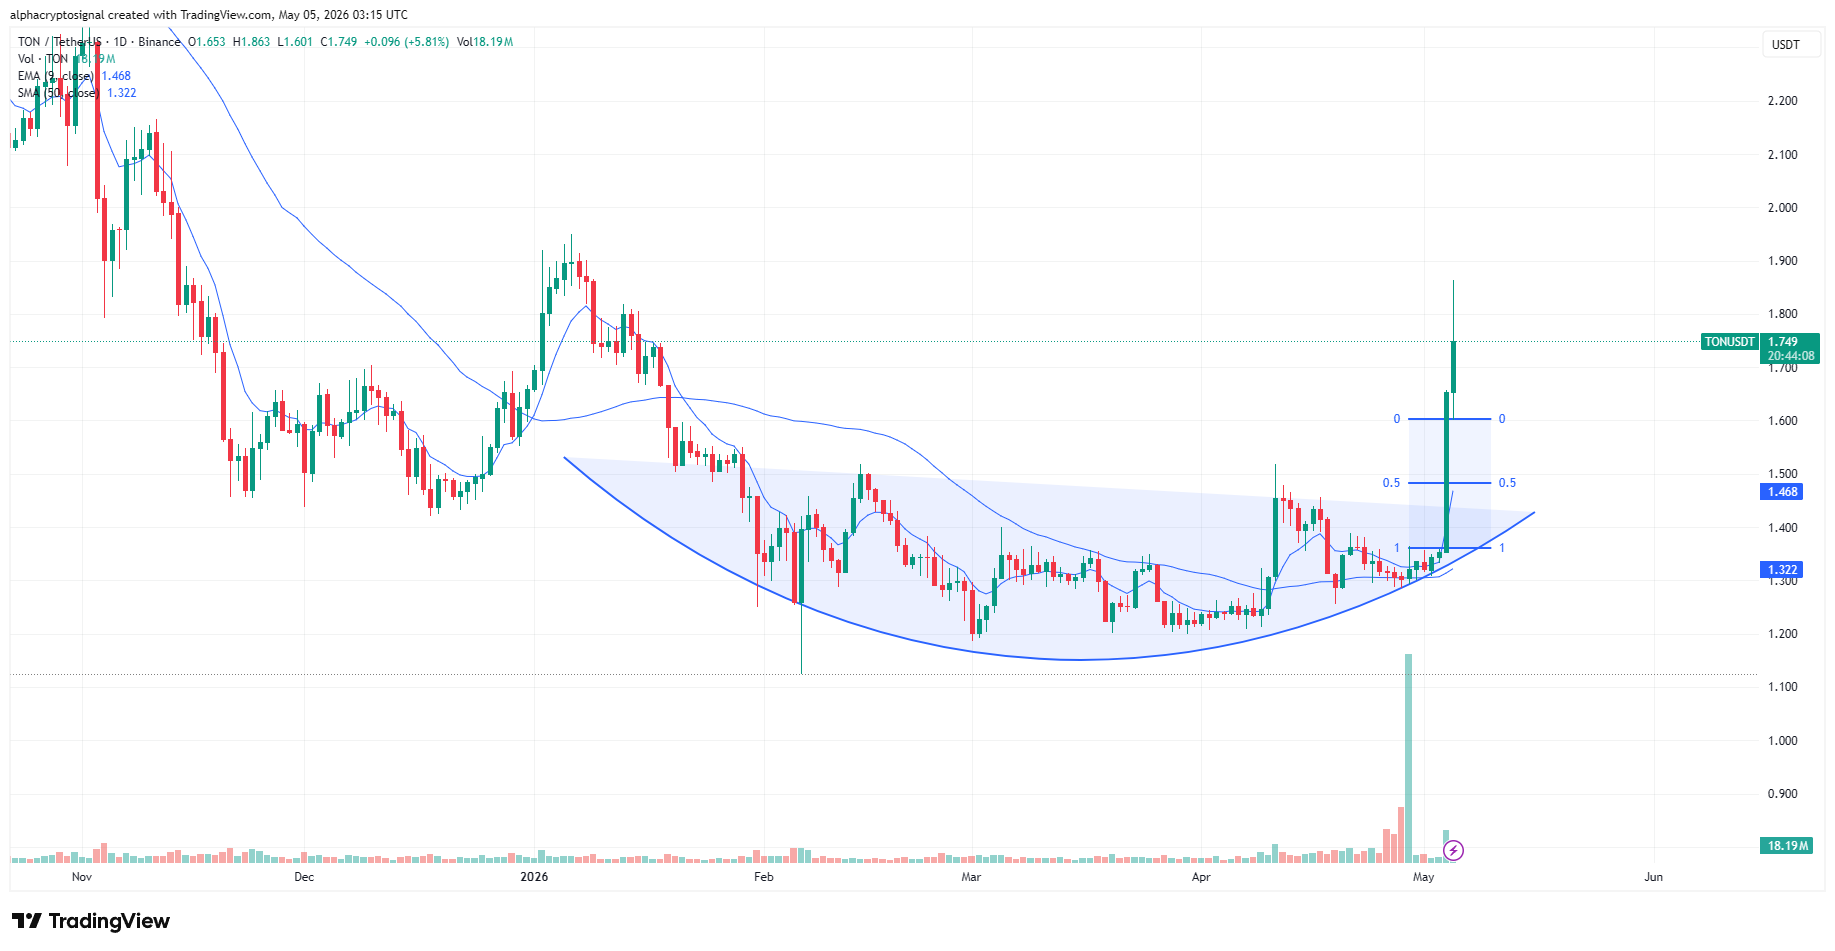
AVAX price chart (live)
Hourly candlesticks (about 96 bars), same endpoint as our cryptocurrency price pages. Numbers below refresh from 1-minute klines.
Full AVAX price, calculator & analysis
Technical Picture Coiling for Breakout
The indicator constellation tells a story of equilibrium ready to shatter. RSI hovers at neutral territory while momentum oscillators show flat readings—the calm before directional storms. This technical balance combined with compressed volatility creates ideal breakout conditions.
Price action remains pinned below the 20-day moving average at $9.30, but the proximity suggests any buying pressure could quickly reclaim this level. The Bollinger Band position indicates significant room for expansion, particularly to the upside where resistance thins above $9.43.
The 200-day moving average at $12.13 represents the ultimate technical prize. Breaking above this level would signal the end of the corrective phase and likely trigger algorithmic buying programs that could accelerate price discovery toward double digits rapidly.
Smart Money vs Retail Positioning
The derivatives market exposes a striking divergence in positioning that historically precedes major moves. While retail traders maintain modest bullish positioning at 57.9% long, institutional players have built significantly larger long exposure at 63.7%.
This 6-percentage-point gap between retail and whale positioning creates an asymmetric setup. Large traders don't maintain concentrated long positions without conviction in near-term catalysts, and their willingness to hold through recent chop suggests they expect resolution higher.
The taker buy/sell ratio at 0.68 shows continued selling pressure, but this likely represents strategic accumulation by institutions rather than genuine bearish sentiment. Smart money often disguises buying activity to avoid moving prices against their entry zones.
Price Targets and Risk Management
The bullish scenario activates above $9.61 resistance, where momentum algorithms likely trigger breakout strategies targeting the 200-day average at $12.13. Success at this level opens the door to $15 within 90 days—a 62% gain from current levels that aligns with historical breakout magnitudes.
Downside risk concentrates around $8.79 support, where failure could send AVAX toward the $7.50-$8.00 zone. However, with institutional positioning heavily skewed long and open interest remaining stable, any weakness below $9.00 should be viewed as opportunity rather than trend change.
The risk-reward profile strongly favors long positioning with stops below $8.50. Given the technical setup and positioning divergence, AVAX appears ready for its next major leg higher once resistance breaks.
Blockchain.news Crypto Market
Image source: Shutterstock- avax price analysis
- avax price prediction