The post Here’s Why Bitcoin Cash (BCH) Is Up Today?  appeared first on Coinpedia Fintech News Bitcoin Cash, a cryptocurrency that is a fork of Bitcoin, has seenThe post Here’s Why Bitcoin Cash (BCH) Is Up Today?  appeared first on Coinpedia Fintech News Bitcoin Cash, a cryptocurrency that is a fork of Bitcoin, has seen

Here’s Why Bitcoin Cash (BCH) Is Up Today?

Bitcoin Cash (BCH) Price

The post Here’s Why Bitcoin Cash (BCH) Is Up Today?  appeared first on Coinpedia Fintech News

Bitcoin Cash, a cryptocurrency that is a fork of Bitcoin, has seen a sharp rise today, jumping nearly 12%, trading around $588, making it one of the top-performing cryptocurrencies.

While Bitcoin and most other major coins are trading in the red, Bitcoin Cash’s sudden surge has surprised the market, raising questions about what’s driving the rally.

Strong Buying Interest Drives Bitcoin Cash Higher

One key reason behind Bitcoin Cash’s sharp rise is strong interest from retail traders. BCH started moving higher after the latest US inflation data showed CPI at 2.7%, which improved overall market sentiment. 

At the same time, the coin has seen strong independent momentum, largely ignoring the Bank of Japan’s recent rate hike to 0.75%.

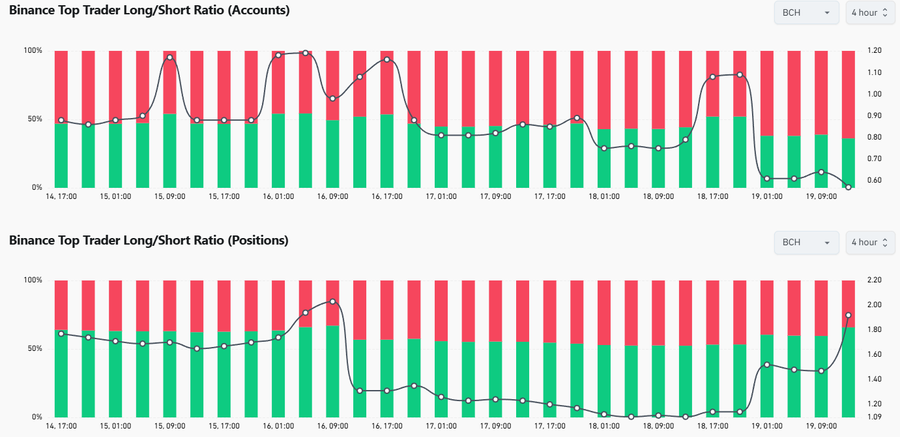
On top of it, data from Binance shows top traders are increasing their long positions in Bitcoin Cash. Both the number of traders betting on higher prices and the size of their positions have risen, suggesting strong confidence that BCH could move even higher.

Binance shows top traders are increasing their long positions

Rising Futures Interest Signals Confidence

Another key reason behind Bitcoin Cash’s rally is growing activity in the futures market. Recent data shows that open interest in BCH futures has reached a six-month high, meaning more traders are placing bets on higher prices ahead.

According to CoinGlass, BCH futures open interest jumped 18.69% in the last 24 hours, rising to $761.48 million. This shows fresh money is entering the market as traders take on more risk. 

At the same time, the funding rate has turned positive, signaling that bullish traders are now willing to pay to keep their long positions open.

Key Resistance at $615 in Focus

Looking at the Bitcoin Cash 4-hour chart, BCH is trading above key moving averages, which is boosting bullish confidence. The price recently bounced from around $530, forming a double-bottom pattern, a signal that often points to a possible trend reversal.

Traders are now closely watching the $600–$625 zone, which acts as a strong resistance area. In particular, $615 has emerged as a major sell wall where selling pressure is high.

bitcoin cash price chart

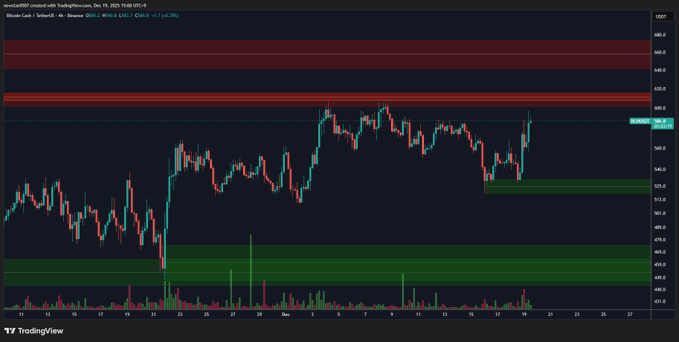
If BCH manages to break and hold above $615, analysts believe it could trigger the next leg higher, with a possible move toward $640. However, failure to clear this level may lead to short-term consolidation.

Market Opportunity
WHY Logo
WHY Price(WHY)
$0.00000001515
$0.00000001515$0.00000001515
-0.19%
USD
WHY (WHY) Live Price Chart
Disclaimer: The articles reposted on this site are sourced from public platforms and are provided for informational purposes only. They do not necessarily reflect the views of MEXC. All rights remain with the original authors. If you believe any content infringes on third-party rights, please contact service@support.mexc.com for removal. MEXC makes no guarantees regarding the accuracy, completeness, or timeliness of the content and is not responsible for any actions taken based on the information provided. The content does not constitute financial, legal, or other professional advice, nor should it be considered a recommendation or endorsement by MEXC.

You May Also Like

REX Shares’ Solana staking ETF sees $10M inflows, AUM tops $289M for first time

REX Shares’ Solana staking ETF sees $10M inflows, AUM tops $289M for first time

The post REX Shares’ Solana staking ETF sees $10M inflows, AUM tops $289M for first time appeared on BitcoinEthereumNews.com. Key Takeaways REX Shares’ Solana staking ETF saw $10 million in inflows in one day. Total inflows over the past three days amount to $23 million. REX Shares’ Solana staking ETF recorded $10 million in inflows yesterday, bringing total additions to $23 million over the past three days. The fund’s assets under management climbed above $289.0 million for the first time. The SSK ETF is the first U.S. exchange-traded fund focused on Solana staking. Source: https://cryptobriefing.com/rex-shares-solana-staking-etf-aum-289m/
Share
BitcoinEthereumNews2025/09/18 02:34
Microsoft Corp. $MSFT blue box area offers a buying opportunity

Microsoft Corp. $MSFT blue box area offers a buying opportunity

The post Microsoft Corp. $MSFT blue box area offers a buying opportunity appeared on BitcoinEthereumNews.com. In today’s article, we’ll examine the recent performance of Microsoft Corp. ($MSFT) through the lens of Elliott Wave Theory. We’ll review how the rally from the April 07, 2025 low unfolded as a 5-wave impulse followed by a 3-swing correction (ABC) and discuss our forecast for the next move. Let’s dive into the structure and expectations for this stock. Five wave impulse structure + ABC + WXY correction $MSFT 8H Elliott Wave chart 9.04.2025 In the 8-hour Elliott Wave count from Sep 04, 2025, we saw that $MSFT completed a 5-wave impulsive cycle at red III. As expected, this initial wave prompted a pullback. We anticipated this pullback to unfold in 3 swings and find buyers in the equal legs area between $497.02 and $471.06 This setup aligns with a typical Elliott Wave correction pattern (ABC), in which the market pauses briefly before resuming its primary trend. $MSFT 8H Elliott Wave chart 7.14.2025 The update, 10 days later, shows the stock finding support from the equal legs area as predicted allowing traders to get risk free. The stock is expected to bounce towards 525 – 532 before deciding if the bounce is a connector or the next leg higher. A break into new ATHs will confirm the latter and can see it trade higher towards 570 – 593 area. Until then, traders should get risk free and protect their capital in case of a WXY double correction. Conclusion In conclusion, our Elliott Wave analysis of Microsoft Corp. ($MSFT) suggested that it remains supported against April 07, 2025 lows and bounce from the blue box area. In the meantime, keep an eye out for any corrective pullbacks that may offer entry opportunities. By applying Elliott Wave Theory, traders can better anticipate the structure of upcoming moves and enhance risk management in volatile markets. Source: https://www.fxstreet.com/news/microsoft-corp-msft-blue-box-area-offers-a-buying-opportunity-202509171323
Share
BitcoinEthereumNews2025/09/18 03:50
The Digital WOW Explains How AI Is Affecting Digital Marketing

The Digital WOW Explains How AI Is Affecting Digital Marketing

WEST PALM BEACH, Fla., Dec. 19, 2025 /PRNewswire/ — The Digital WOW, powered by ConsultPR.net, announces new findings on how AI is affecting digital marketing.
Share
AI Journal2025/12/19 17:30