

BNB Smashes Past $1K to New ATH as Bitcoin Slips Further From $116K (Weekend Watch)
Bitcoin’s rather dull price movements over the weekend continue as the asset has fallen away from the $116,000 level, which it challenged yesterday.
Most larger-cap altcoins are also quite sluggish, aside from BNB, which keeps charting fresh peaks, with the latest being well above $1,050.
BTC to Lose $116K?
The primary cryptocurrency’s business week began with a price surge from under $115,000 to almost $117,000, where it faced an immediate rejection that drove it south by over two-and-a-half grand. More volatility ensued in the following days, especially leading to the Wednesday FOMC meeting, in which the US Federal Reserve finally reduced the key interest rates by 25 bps.
In the hours before the announcement, BTC jumped past $117,000, dropped below $115,000, and recovered to $116,000. Once the rate cut became known, bitcoin remained relatively sluggish at first.
However, the asset went on the offensive during the early Thursday morning trading hours when it jumped to $118,000 to mark a multi-week high. That momentum was short-lived, though, as bitcoin started to lose value gradually and dropped to $115,200 on Friday.
It bounced to just over $116,000 yesterday but was stopped and is now positioned between $115,000 and $116,000. Its market cap has stalled at $2.3 trillion, while its dominance over the alts sits close to 56% on CG.
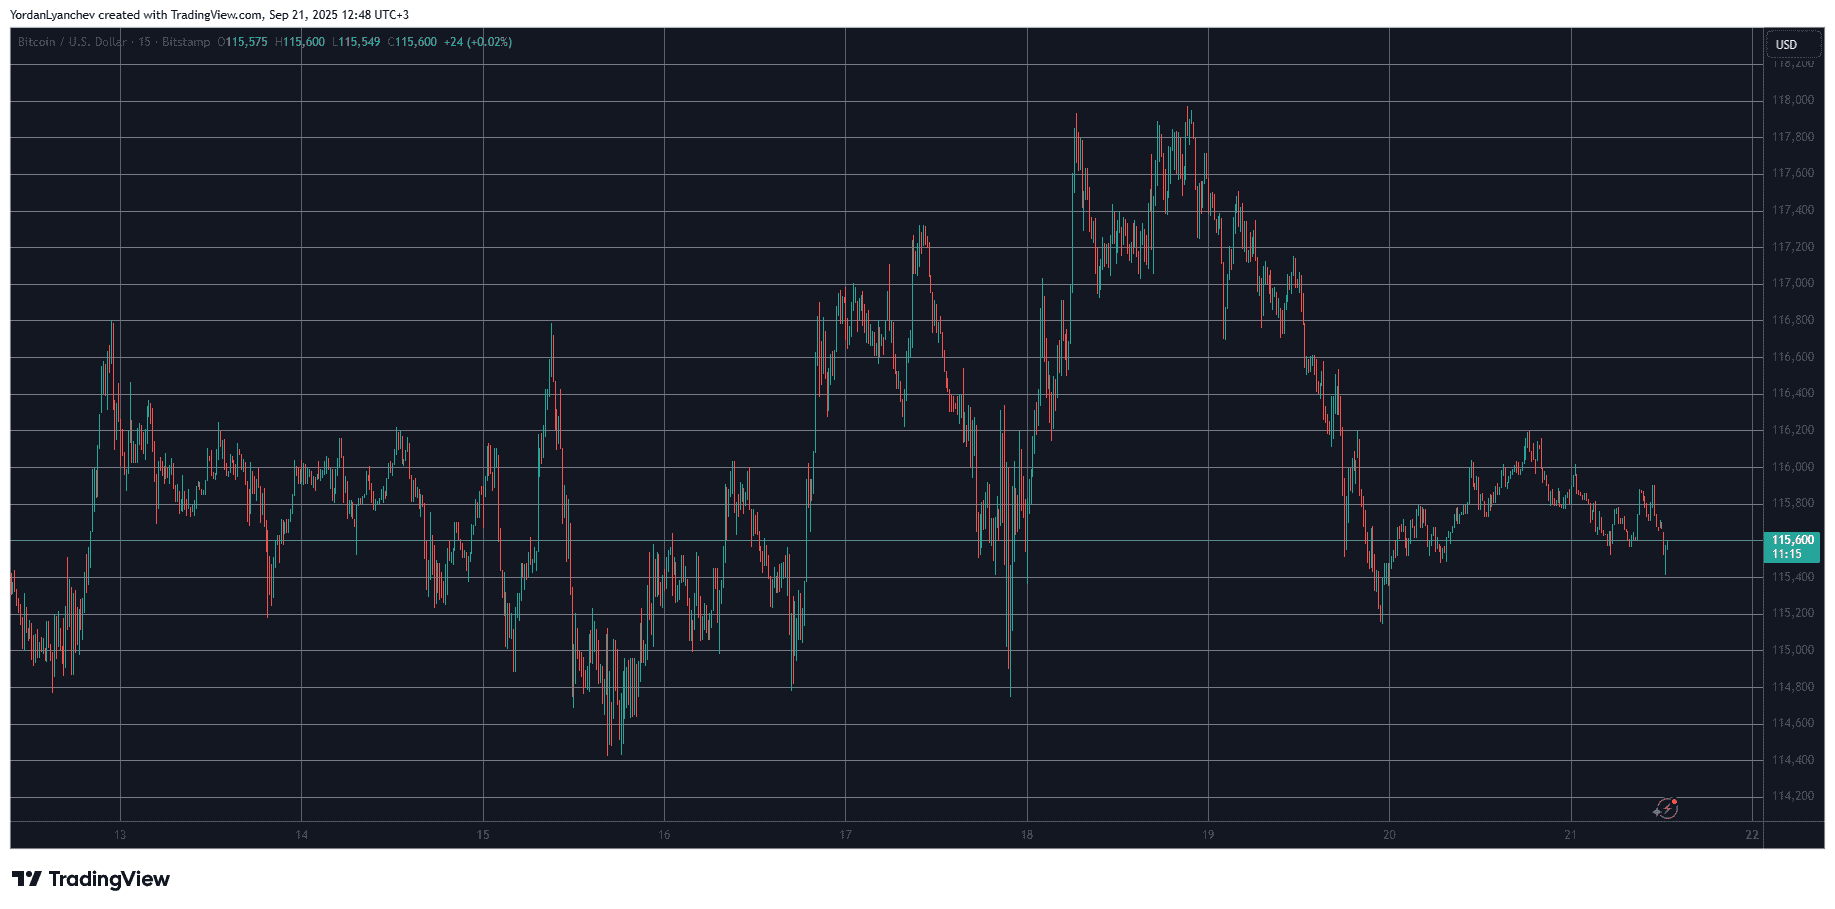 BTCUSD. Source: TradingView
BNB’s World
It’s safe to say that BNB has been the rockstar of the larger-cap alts in the past week or so. The asset has marked repeated new all-time highs, especially since it broke above $1,000. In the past 24 hours alone, it exploded by around 10% and charted a fresh peak at $1,080 (on CoinGecko). Although it has retraced slightly since then, it’s still the top performer from the largest alts.
In contrast, ETH, XRP, SOL, DOGE, ADA, TRX, LINK, AVAX, and SUI have made no big moves, while HYPE has plunged by over 5%.
ASTER continues to chart notable gains, adding over 40% of value in the past day. M and IP follow suit, with increases of 18% and 15%, respectively.
The total crypto market cap has shed around $20 billion overnight and is down to $4.120 trillion on CG.
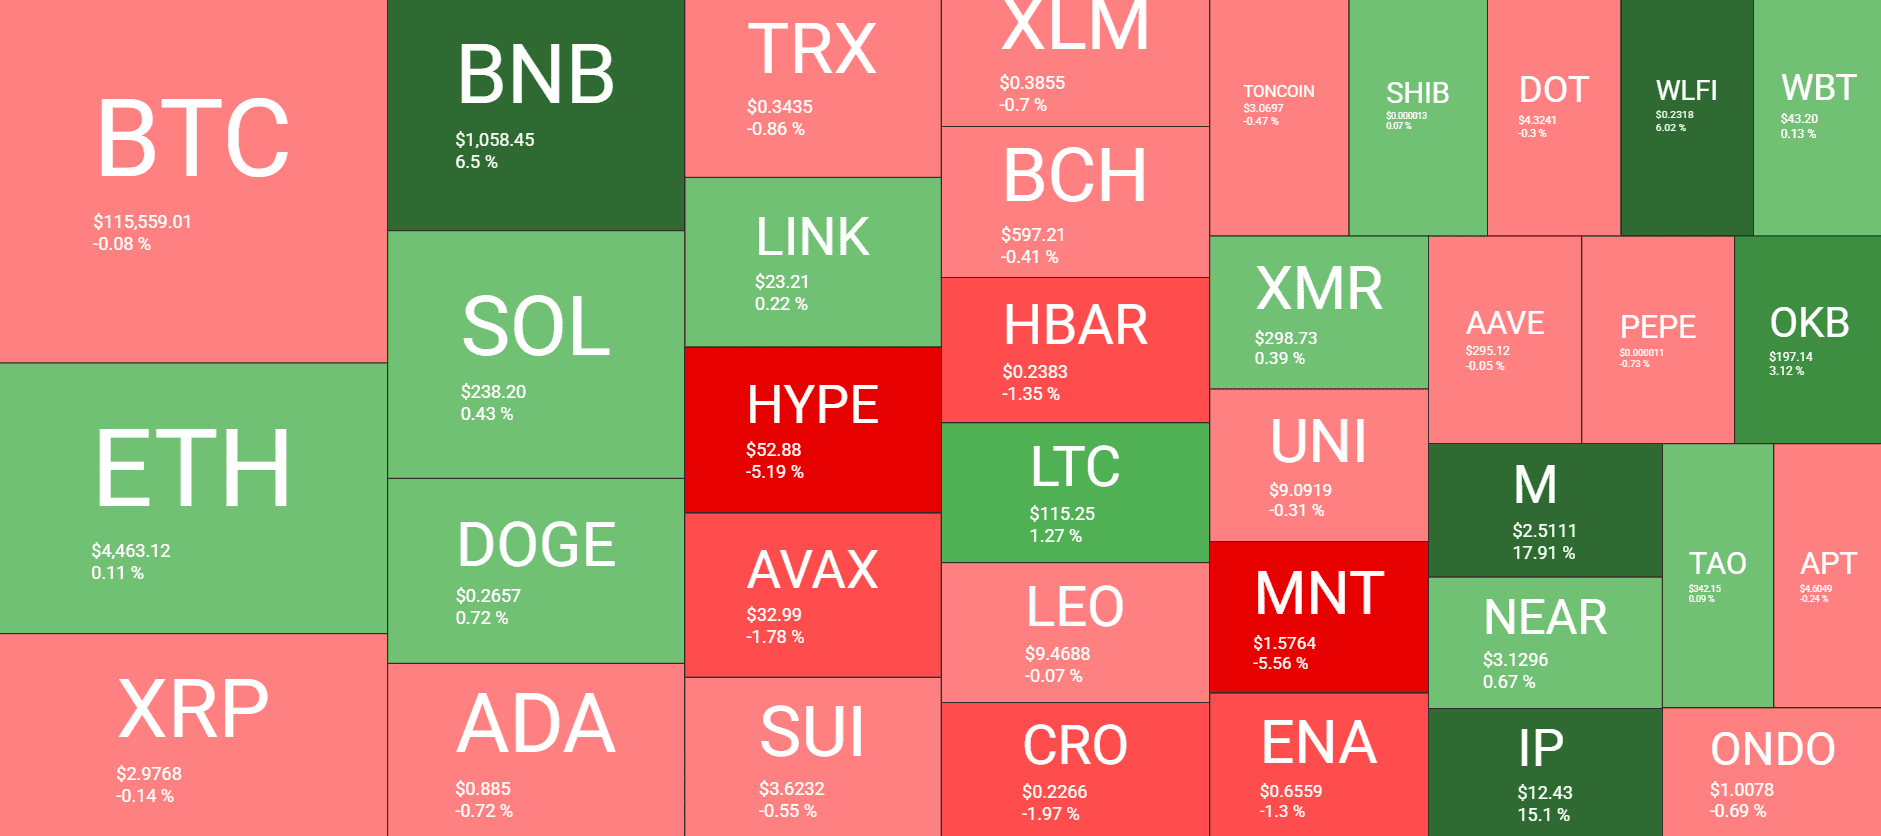 Cryptocurrency Market Overview. Source: QuantifyCrypto
The post BNB Smashes Past $1K to New ATH as Bitcoin Slips Further From $116K (Weekend Watch) appeared first on CryptoPotato.
You May Also Like

Microsoft Corp. $MSFT blue box area offers a buying opportunity

WTI drifts higher above $59.50 on Kazakh supply disruptions
