

Bitcoin Price Could Still Crash To $99,000 If This Happens, Warns Ostium Labs
Ostium Research’s latest weekly note opened with Bitcoin under pressure after a swift selloff into the new week, describing “a mass liquidation event” that pushed price as low as $111,761, after rejection near resistance in the mid-$117,000s.
The team frames the drawdown as part of a previously flagged “window of weakness… into early October,” while stressing the higher-timeframe uptrend remains intact unless key weekly levels fail. The report, published September 22, 2025, sets out both the technical map and the event calendar that could govern path-dependency over the next several sessions.
Bitcoin Crash To $99,000 Looms
On the weekly chart, Ostium notes last week’s consolidation around the August open and a wick into “key resistance… at $117.5k,” followed by a close marginally below the open. Early-week price action then carried price beneath reclaimed support into the $111k handle, with the analysts highlighting “over $1.6bn in longs liquidated so far today.”
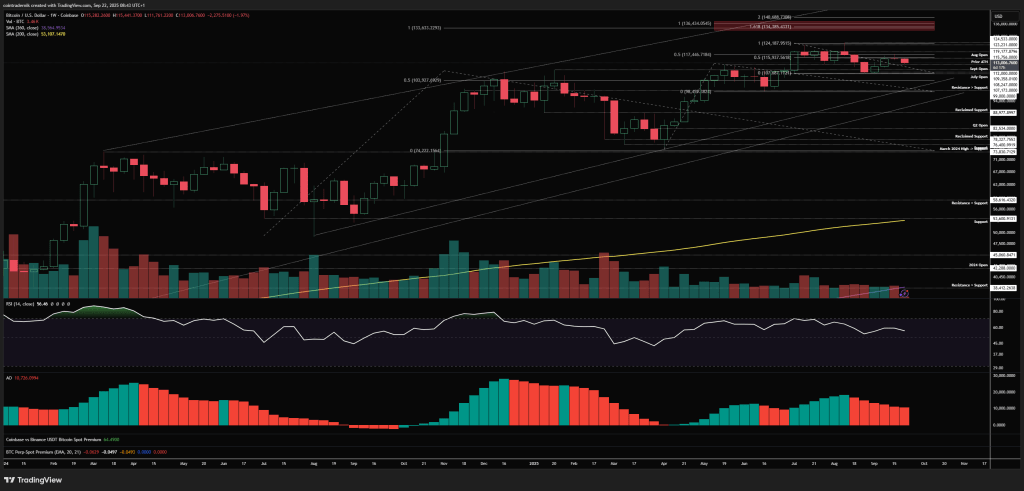
Two structural inflection zones anchor the bearish risk: “Acceptance below $107k on a weekly close would open up more downside into $99k,” whereas on the topside “the weekly high at $115.3k… is at least revisited some time later in the week.”
On the daily timeframe, the August open at $115.7k is the pivot the market must reclaim to reassert momentum. As the authors put it, “that August open at $115.7k [is] a key level to flip into support to resume bullishness.”
The immediate battleground is the prior all-time high at $112k, where “a reclaim of $112k as support” would tilt probabilities toward a higher low and force shorts to cover into a move back through $115.7k. Their base case, however, is for additional chop “between $112k-$115k before a second push lower below today’s low,” which will determine whether the market undercuts the June swing at $107k or marks out a bottom sooner.

Tactically, Ostium lays out both long and short triggers with unusual clarity. On the long side: “a sweep of today’s low early this week and then a reclaim of $112k as support,” riding momentum “back into the weekly high.” On the short side, they float what they call “a really nice short setup… a sharp v-reversal… back above the weekly high… before… rejecting and breaking back below $115.3k,” which would then target “$112k and lower.” In other words, a squeeze-then-fade path that punishes both late longs and late shorts.
Positioning and derivatives breadth round out the near-term blueprint. The note shares snapshots of 3-month annualized basis, Bitcoin versus altcoin open interest, and one-week/one-month liquidation maps, underscoring how quickly liquidity pockets can flip into magnets in thin conditions.
This informs their near-term expectation that “the next leg lower or second liquidation event this week [could] be a high probability low,” followed by a retest of $115.3k that will act as the tape’s verdict on whether another down-leg or a bear-trap reversal is in play into quarter-end.
The house view remains probabilistic rather than doctrinaire. If $107k fails on a weekly close, the weakness window could extend into “$99k”; if it holds—and especially if the market can “flip $115.7k into support”—the higher-low narrative stays alive. In the authors’ words, for Ethereum “nothing about this higher timeframe structure or momentum is currently giga-bearish,” and, by analogy, Bitcoin’s structure is best judged by the reaction around $111.7k–$112k this week.
Whether today’s flush proves to be prelude to capitulation or the trap before new highs, Ostium’s bottom line is clear: “we move much higher from early October” unless those weekly thresholds are accepted lower.
At press time, BTC traded at $113,002.


You May Also Like

Tilray Brands (TLRY) Stock Jumps 8% on Record Q3 Revenue Beat
![[Pitik Bulag] April Fool’s Day in cartoons](https://pitikbulag.rappler.com/tachyon/sites/18/2026/04/zach.jpg?resize=150%2C150&crop_strategy=attention)
[Pitik Bulag] April Fool’s Day in cartoons


