This article introduces a predictive framework that optimizes data-center disk scrubbing. Instead of treating drives as simply “healthy” or “failing,” a Mondrian Conformal Prediction model assigns each disk a health confidence score to guide targeted maintenance. Combined with a workload predictor using a Probabilistically Weighted Fuzzy Time Series (PWFTS) algorithm, it determines the best time to perform scrubbing when system load is low. The result: reduced downtime, improved efficiency, and lower carbon emissions in large-scale storage systems.This article introduces a predictive framework that optimizes data-center disk scrubbing. Instead of treating drives as simply “healthy” or “failing,” a Mondrian Conformal Prediction model assigns each disk a health confidence score to guide targeted maintenance. Combined with a workload predictor using a Probabilistically Weighted Fuzzy Time Series (PWFTS) algorithm, it determines the best time to perform scrubbing when system load is low. The result: reduced downtime, improved efficiency, and lower carbon emissions in large-scale storage systems.

How Predictive Algorithms Are Making Data Center Disk Scrubbing Smarter

2025/10/07 19:00
5 min read
For feedback or concerns regarding this content, please contact us at crypto.news@mexc.com

Abstract and 1. Introduction

  1. Motivation and design goals

  2. Related Work

  3. Conformal prediction

    4.1. Mondrian conformal prediction (MCP)

    4.2. Evaluation metrics

  4. Mondrian conformal prediction for Disk Scrubbing: our approach

    5.1. System and Storage statistics

    5.2. Which disk to scrub: Drive health predictor

    5.3. When to scrub: Workload predictor

  5. Experimental setting and 6.1. Open-source Baidu dataset

    6.2. Experimental results

  6. Discussion

    7.1. Optimal scheduling aspect

    7.2. Performance metrics and 7.3. Power saving from selective scrubbing

  7. Conclusion and References

5.2. Which disk to scrub: Drive health predictor

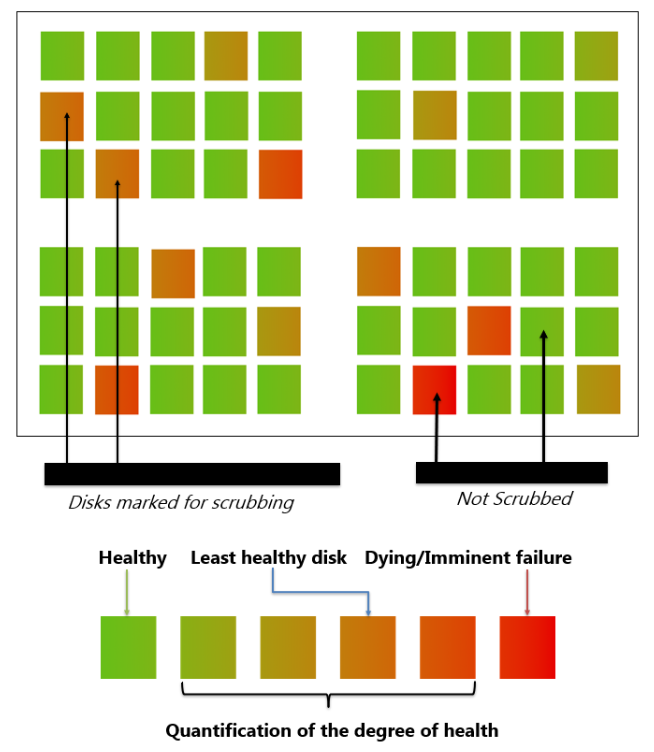
In a normal data center setting, all disk drives are classified as either healthy or unhealthy. Unhealthy disks are supposed to be dying or imminently failing, thus they are not marked for scrubbing, while healthy disks are marked for scrubbing.

\ In our approach, we propose to assign a relative ’degree of health’ score to each disk. Drives that are marked as of No concern are either dying/imminently failing or completely healthy, while those marked as of Concern have different degrees of health other than failing or healthy. The conformal prediction framework then classifies the ”No-concern” and ”Concern” drives, and only selects the disks which are in the set of ”Concern” drives for further ranking. These are the drives which are concerning to us and is used as input for the scrubbing scheduler.

\ Our focus, as shown in Figure 2, is on identifying disks in the system that are currently of concern or may become concerning soon, and only selecting those disks for scrubbing. This approach reduces the number of disks meant for scrubbing, since even completely healthy drives are not scrubbed, making the process more efficient and targeted. By doing so, we optimize time, power, and energy consumption and reduce the carbon footprint of data centers.

\ Figure 2: Quantifying the health of disk drives: The disks which are healthy and nonhealthy are not selected for scrubbing, while the disks of concern are marked for scrubbing.

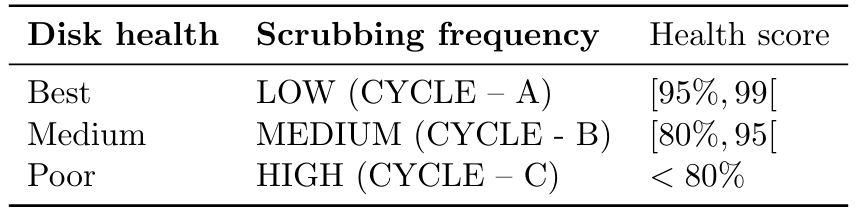
\ When dealing with disk drives in a usual data center environment, failures are rare over a period of time, resulting in a highly imbalanced dataset with a small number of failed disks and the majority of disks being healthy. To handle this imbalanced data, we adopt a Mondrian Conformal Prediction approach, in order to get the prediction labels ”0”: failed and ”1”: healthy, along with their confidence score that serves as a health score in our case. This means that our MCP algorithm selects disks with a confidence score depending on the threshold chosen by the administrator.

\ For instance, if the administrator sets a threshold of 1%, this will lead to excluding disks with health scores above 99% as healthy or failing (depending on the label) and only selecting disks with a health score lower than 99% for scrubbing. Furthermore, the selected drives can be mapped to distinct scrubbing frequencies. Thus, drives with poor health scores may require more frequent scrubbing (every week), while those with good health scores will need less frequent scrubbing (every 3 months). For the same threshold of 1%, the administrator can then map the disk health with a scrubbing frequency, as in Table 1.

\ Table 1: Mapping of the disk health with the scrubbing frequency based on health score.

\

5.3. When to scrub: Workload predictor

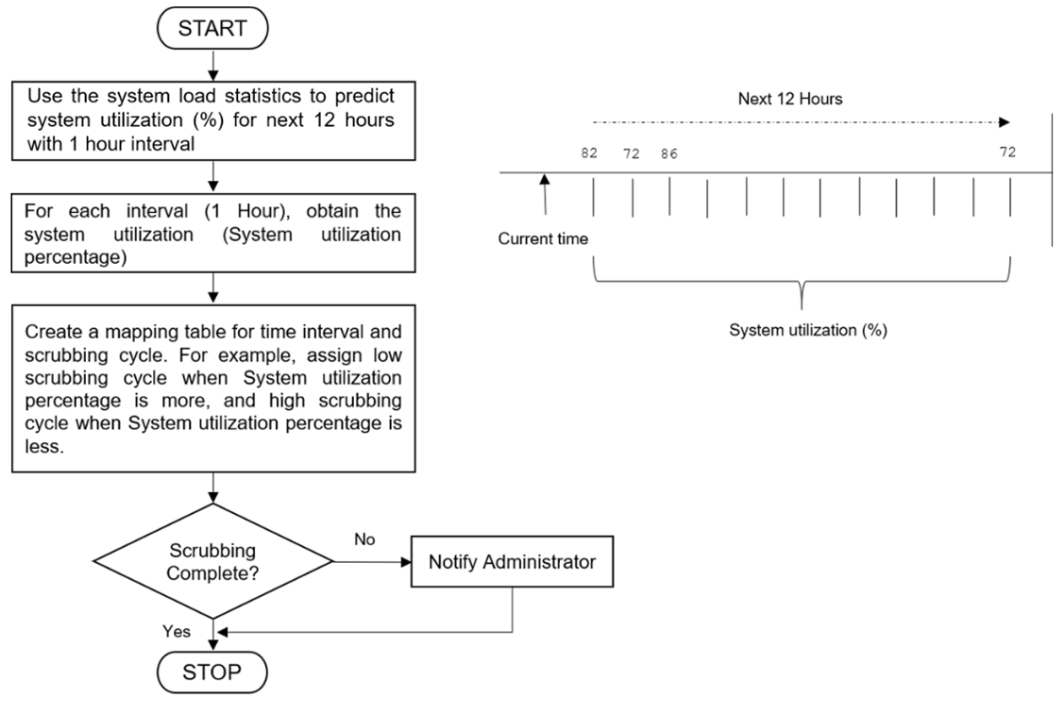
After identifying the disks to be scrubbed using the drive health predictor engine, the next step is to determine the optimal time to perform scrubbing using the workload predictor. This component needs to consider the availability of system resources, i.e. disk and CPU utilization information in the system and storage statistics subsystem.

\ The workload predictor employs a Probabilistically Weighted Fuzzy Time Series algorithm (PWFTS), as detailed in (Orang et al., 2020). This algorithm forecasts n-days ahead system utilization, by predicting the system utilization percentage for the next 12 hours, with 1-hour intervals. Then, this information is combined with one of the three possible scrubbing cycles (A, B, or C as in Table 1) obtained from the drive health predictor. Finally, the scrubbing is triggered. During the 1-hour interval, if the scrubbing is complete, then we stop, if not, the administrator is notified. The high-level flowchart for the system workload predictor is outlined in Figure 3.

\ \ Figure 3: Flowchart of the workload predictor using the PWFTS algorithm.

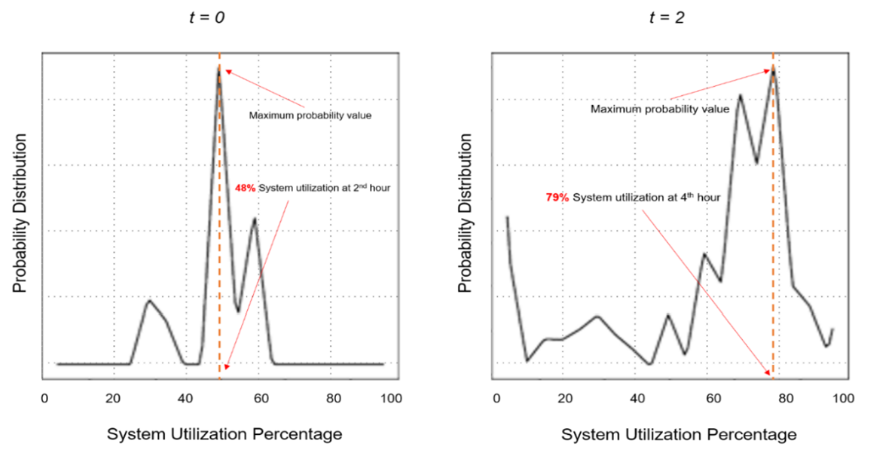
\ \ In Figure 4, we showcase the n-days ahead forecasting of the system utilization percentage. It is evident from the figure that the system exhibits a lower load on day 0 and a higher load on day 2. Consequently, scheduling the scrubbing operations at day 0, when the system is under a lower load, would be more favorable. This approach optimizes the utilization of system resources, ensuring efficient scrubbing of the disks, and leading to lower processing time, lower energy consumption, and a reduced carbon footprint of the data center.

\ \ Figure 4: Probability distribution of system utilization percentage for n-days ahead forecasting.

\ \ \

:::info This paper is available on arxiv under CC BY-NC-ND 4.0 Deed (Attribution-Noncommercial-Noderivs 4.0 International) license.

:::


:::info Authors:

(1) Rahul Vishwakarma, California State University Long Beach, 1250 Bellflower Blvd, Long Beach, CA 90840, United States (rahuldeo.vishwakarma01@student.csullb.edu);

(2) Jinha Hwang, California State University Long Beach, 1250 Bellflower Blvd, Long Beach, CA 90840, United States (jinha.hwang01@student.csulb.edu);

(3) Soundouss Messoudi, HEUDIASYC - UMR CNRS 7253, Universit´e de Technologie de Compiegne, 57 avenue de Landshut, 60203 Compiegne Cedex - France (soundouss.messoudi@hds.utc.fr);

(4) Ava Hedayatipour, California State University Long Beach, 1250 Bellflower Blvd, Long Beach, CA 90840, United States (ava.hedayatipour@csulb.edu).

:::

\

Disclaimer: The articles reposted on this site are sourced from public platforms and are provided for informational purposes only. They do not necessarily reflect the views of MEXC. All rights remain with the original authors. If you believe any content infringes on third-party rights, please contact crypto.news@mexc.com for removal. MEXC makes no guarantees regarding the accuracy, completeness, or timeliness of the content and is not responsible for any actions taken based on the information provided. The content does not constitute financial, legal, or other professional advice, nor should it be considered a recommendation or endorsement by MEXC.

You May Also Like

US Treasury Turns to AI to Combat Crypto Fraud After $9B in Losses

US Treasury Turns to AI to Combat Crypto Fraud After $9B in Losses

The United States Department of the Treasury is looking at artificial intelligence technology to help prevent cryptocurrency fraud in digital markets. The officials
Share
Thenewscrypto2026/03/09 22:10
‘Great Progress’: Cardano Founder Shares Update After CLARITY Act Roundtable

‘Great Progress’: Cardano Founder Shares Update After CLARITY Act Roundtable

                         Read the full article at                             coingape.com.                         
Share
Coinstats2025/09/18 03:18
Ethereum koers toont zeldzaam dubbel koopsignaal en richt zich op $4.550

Ethereum koers toont zeldzaam dubbel koopsignaal en richt zich op $4.550

Connect met Like-minded Crypto Enthusiasts! Connect op Discord! Check onze Discord   Ethereum laat op de uurgrafiek twee opeenvolgende TD Sequential koopsignalen zien. Deze indicator meet uitputting in een trend en geeft vaak een signaal dat de verkoopdruk kan afnemen. Dit dubbele signaal verschijnt rond het niveau van $4.516, waar de ETH prijs kortstondig steun vindt. Dit type formatie komt zelden voor en wordt daarom extra nauwlettend gevolgd. Wat gaat de Ethereum koers hiermee doen? Ethereum koers test steun rond $4.516 De scherpe daling van de Ethereum koers vanaf de prijszone rond $4.800 bracht de ETH prijs in korte tijd naar ongeveer $4.516. Op dit niveau trad duidelijke koopactiviteit op, waardoor de neerwaartse beweging tijdelijk werd gestopt. Het dubbele signaal dat door de TD Sequential indicator is gegenereerd, viel precies samen met dit prijspunt. De TD Sequential is opgebouwd uit negen candles die een trend meetellen. Wanneer de negende candle verschijnt, kan dit duiden op een trendomslag. In dit geval verschenen zelfs twee signalen kort na elkaar, wat aangeeft dat de verkoopdruk mogelijk uitgeput is. Het feit dat dit gebeurde in een zone waar ETH kopers actief bleven, maakt het patroon extra opvallend. TD Sequential just flashed two buy signals for Ethereum $ETH! pic.twitter.com/JPO8EhiEPi — Ali (@ali_charts) September 16, 2025 Welke crypto nu kopen?Lees onze uitgebreide gids en leer welke crypto nu kopen verstandig kan zijn! Welke crypto nu kopen? Fed-voorzitter Jerome Powell heeft aangekondigd dat de rentes binnenkort zomaar eens omlaag zouden kunnen gaan, en tegelijkertijd blijft BlackRock volop crypto kopen, en dus lijkt de markt klaar om te gaan stijgen. Eén vraag komt telkens terug: welke crypto moet je nu kopen? In dit artikel bespreken we de munten die… Continue reading Ethereum koers toont zeldzaam dubbel koopsignaal en richt zich op $4.550 document.addEventListener('DOMContentLoaded', function() { var screenWidth = window.innerWidth; var excerpts = document.querySelectorAll('.lees-ook-description'); excerpts.forEach(function(description) { var excerpt = description.getAttribute('data-description'); var wordLimit = screenWidth wordLimit) { var trimmedDescription = excerpt.split(' ').slice(0, wordLimit).join(' ') + '...'; description.textContent = trimmedDescription; } }); }); Technische indicatoren schetsen herstelkans voor ETH Naast de dubbele koopsignalen verstrekken ook andere indicatoren belangrijke aanwijzingen. Tijdens de daling van de ETH koers waren grote rode candles zichtbaar, maar na de test van $4.516 stabiliseerde de Ethereum koers. Dit wijst op een mogelijke verschuiving in het evenwicht tussen de bears en bulls. Als deze opwaartse beweging doorzet, liggen de eerste weerstanden rond $4.550. Daarboven wacht een sterkere zone rond $4.650. Deze niveaus zijn in eerdere Ethereum sessies al meerdere keren getest. Een doorbraak zou ruimte openen richting de all-time high van ETH rond $4.953. Wanneer de prijs toch opnieuw onder $4.516 zakt, liggen er zones rond $4.500 en $4.450 waar grotere kooporders worden verwacht. Deze niveaus kunnen als een vangnet fungeren, mocht de druk opnieuw toenemen. Marktdynamiek bevestigt technische indicatoren De huidige situatie volgt op een bredere correctie in de cryptomarkt. Verschillende vooraanstaande crypto tokens zagen scherpe koersdalingen, waarna traders op zoek gingen naar signalen voor een mogelijke ommekeer. Dat juist Ethereum nu een dubbel TD Sequential signaal toont, versterkt de interesse in dit scenario. Fundamenteel blijft Ethereum sterk. Het aantal ETH tokens dat via staking is vastgezet, blijft groeien. Dat verkleint de vrije circulatie en vermindert verkoopdruk. Tegelijk blijft het netwerk intensief gebruikt voor DeFi, NFT’s en stablecoins. Deze activiteiten zorgen voor een stabiele vraag naar ETH, ook wanneer de prijs tijdelijk onder druk staat. Fundamentele drijfveren achter de Ethereum koers De Ethereum koers wordt echter niet alleen bepaald door candles en patronen, maar ook door bredere factoren. Een stijgend percentage van de totale ETH supply staat vast in staking contracten. Hierdoor neemt de liquiditeit op exchanges af. Dit kan prijsschommelingen versterken wanneer er plotseling meer koopdruk ontstaat. Daarnaast is Ethereum nog steeds het grootste smart contract platform. Nieuwe standaarden zoals ERC-8004 en ontwikkelingen rond layer-2 oplossingen houden de activiteit hoog. Deze technologische vooruitgang kan de waardepropositie ondersteunen en zo indirect bijdragen aan een ETH prijsherstel. Het belang van de korte termijn dynamiek De komende handelsdagen zullen duidelijk maken of de bulls genoeg kracht hebben om door de weerstandszone rond $4.550 te breken. Voor de bears ligt de focus juist op het verdedigen van de prijsregio rond $4.516. De whales, die met grote handelsorders opereren, kunnen hierin een beslissende rol spelen. Het dubbele TD Sequential signaal blijft hoe dan ook een zeldzame gebeurtenis. Voor cryptoanalisten vormt het een objectief aanknopingspunt om de kracht van de huidige Ethereum trend te toetsen. Vooruitblik op de ETH koers Ethereum liet twee opeenvolgende TD Sequential signalen zien op de uurgrafiek, iets wat zelden voorkomt. Deze formatie viel samen met steun rond $4.516, waar de bulls actief werden. Als de Ethereum koers boven dit niveau blijft, kan er ruimte ontstaan richting $4.550 en mogelijk $4.650. Zakt de prijs toch opnieuw onder $4.516, dan komen $4.500 en $4.450 in beeld als nieuwe steunzones. De combinatie van zeldzame indicatoren en een sterke fundamentele basis maakt Ethereum interessant voor zowel technische als fundamentele analyses. Of de bulls het momentum echt kunnen overnemen, zal blijken zodra de Ethereum koers de eerstvolgende weerstanden opnieuw test. Koop je crypto via Best Wallet Best wallet is een topklasse crypto wallet waarmee je anoniem crypto kan kopen. Met meer dan 60 chains gesupport kan je al je main crypto coins aanschaffen via Best Wallet. Best wallet - betrouwbare en anonieme wallet Best wallet - betrouwbare en anonieme wallet Meer dan 60 chains beschikbaar voor alle crypto Vroege toegang tot nieuwe projecten Hoge staking belongingen Lage transactiekosten Best wallet review Koop nu via Best Wallet Let op: cryptocurrency is een zeer volatiele en ongereguleerde investering. Doe je eigen onderzoek. Het bericht Ethereum koers toont zeldzaam dubbel koopsignaal en richt zich op $4.550 is geschreven door Dirk van Haaster en verscheen als eerst op Bitcoinmagazine.nl.
Share
Coinstats2025/09/17 23:31