Bitcoin price dips below $113K — 10-year low exchange supply drop could fuel recovery
Despite Bitcoin price drop, BTC held on exchanges has dropped to its lowest level in over ten years, a signal that investors are still accumulating rather than selling
- Bitcoin’s exchange balances have dropped to a 10-year low, showing strong accumulation.
- Liquidations cleared excess leverage, creating a healthier setup for recovery.
- Technicals remain mixed, but long-term support near $108K holds firm.
Bitcoin fell below $113,000 as traders retreated after the weekend sell-off triggered by tariff news. In the last week, Bitcoin has dropped roughly 10%, trading between $109,883 and $125,023. The cryptocurrency is now 9% below its Oct. 6 record high of $126,080.
Trading activity also slowed, with daily volume down 25% to about $69 billion, Data from CoinGlass shows derivatives volume rose slightly by 0.14% to $109.97 billion, while open interest fell 1.8% to $73.36 billion.
This mix of rising volume and falling open interest often means traders are closing leveraged positions, a healthy reset after a volatile week.
Bitcoin exchange reserves hit 10-year low
According to an Oct. 14 analysis by CryptoQuant contributor Chairman Lee, the amount of Bitcoin (BTC) stored on centralized exchanges has dropped to around 2.4 million BTC, the lowest level since 2015. In 2020, that figure was more than 3.5 million BTC. The steady decline marks one of the most consistent withdrawal trends in Bitcoin’s history.
Lee notes that when fewer coins are available for trading, selling pressure tends to ease. Historically, such periods of shrinking supply have often come before major rallies, as seen in 2020 and 2021.
This pattern suggests that while prices may appear weak in the short term, the underlying structure remains strong. As long-term holders, institutional investors, and exchange-traded funds continue to transfer Bitcoin into regulated custody and cold wallets, Bitcoin’s supply will tighten even further.
Post-liquidation reset could fuel next rally
Another analysis by XWIN Research Japan compares recent liquidations with previous periods of recovery. Following news of new U.S.-China tariffs, leveraged positions worth about $19 billion were wiped out on Oct. 10. Bitcoin briefly dropped to $104,000 before stabilizing.
History shows that large liquidation events, such as those in 2021, often reset the market rather than sabotage it. When leverage clears out, spot demand usually returns, and prices recover.
This time, ETF inflows, institutional demand, and lower exchange balances suggest the same story is unfolding again. On-chain data shared by XWIN Research Japan backs this up. Funding rates have normalized, and the aSOPR, a key profitability ratio, has moved above 1.0, indicating a shift from panic to accumulation.
What looks like weakness now could be the beginning of a rebuilding phase, as has happened after every major flush in Bitcoin’s history.
Bitcoin price technical analysis
Bitcoin remains in a cautious zone. At 44, the relative strength index indicates neutral momentum. The majority of short-term moving averages (10 to 50 days) indicate mild selling pressure, while momentum and MACD indicators have a slightly bearish bias.
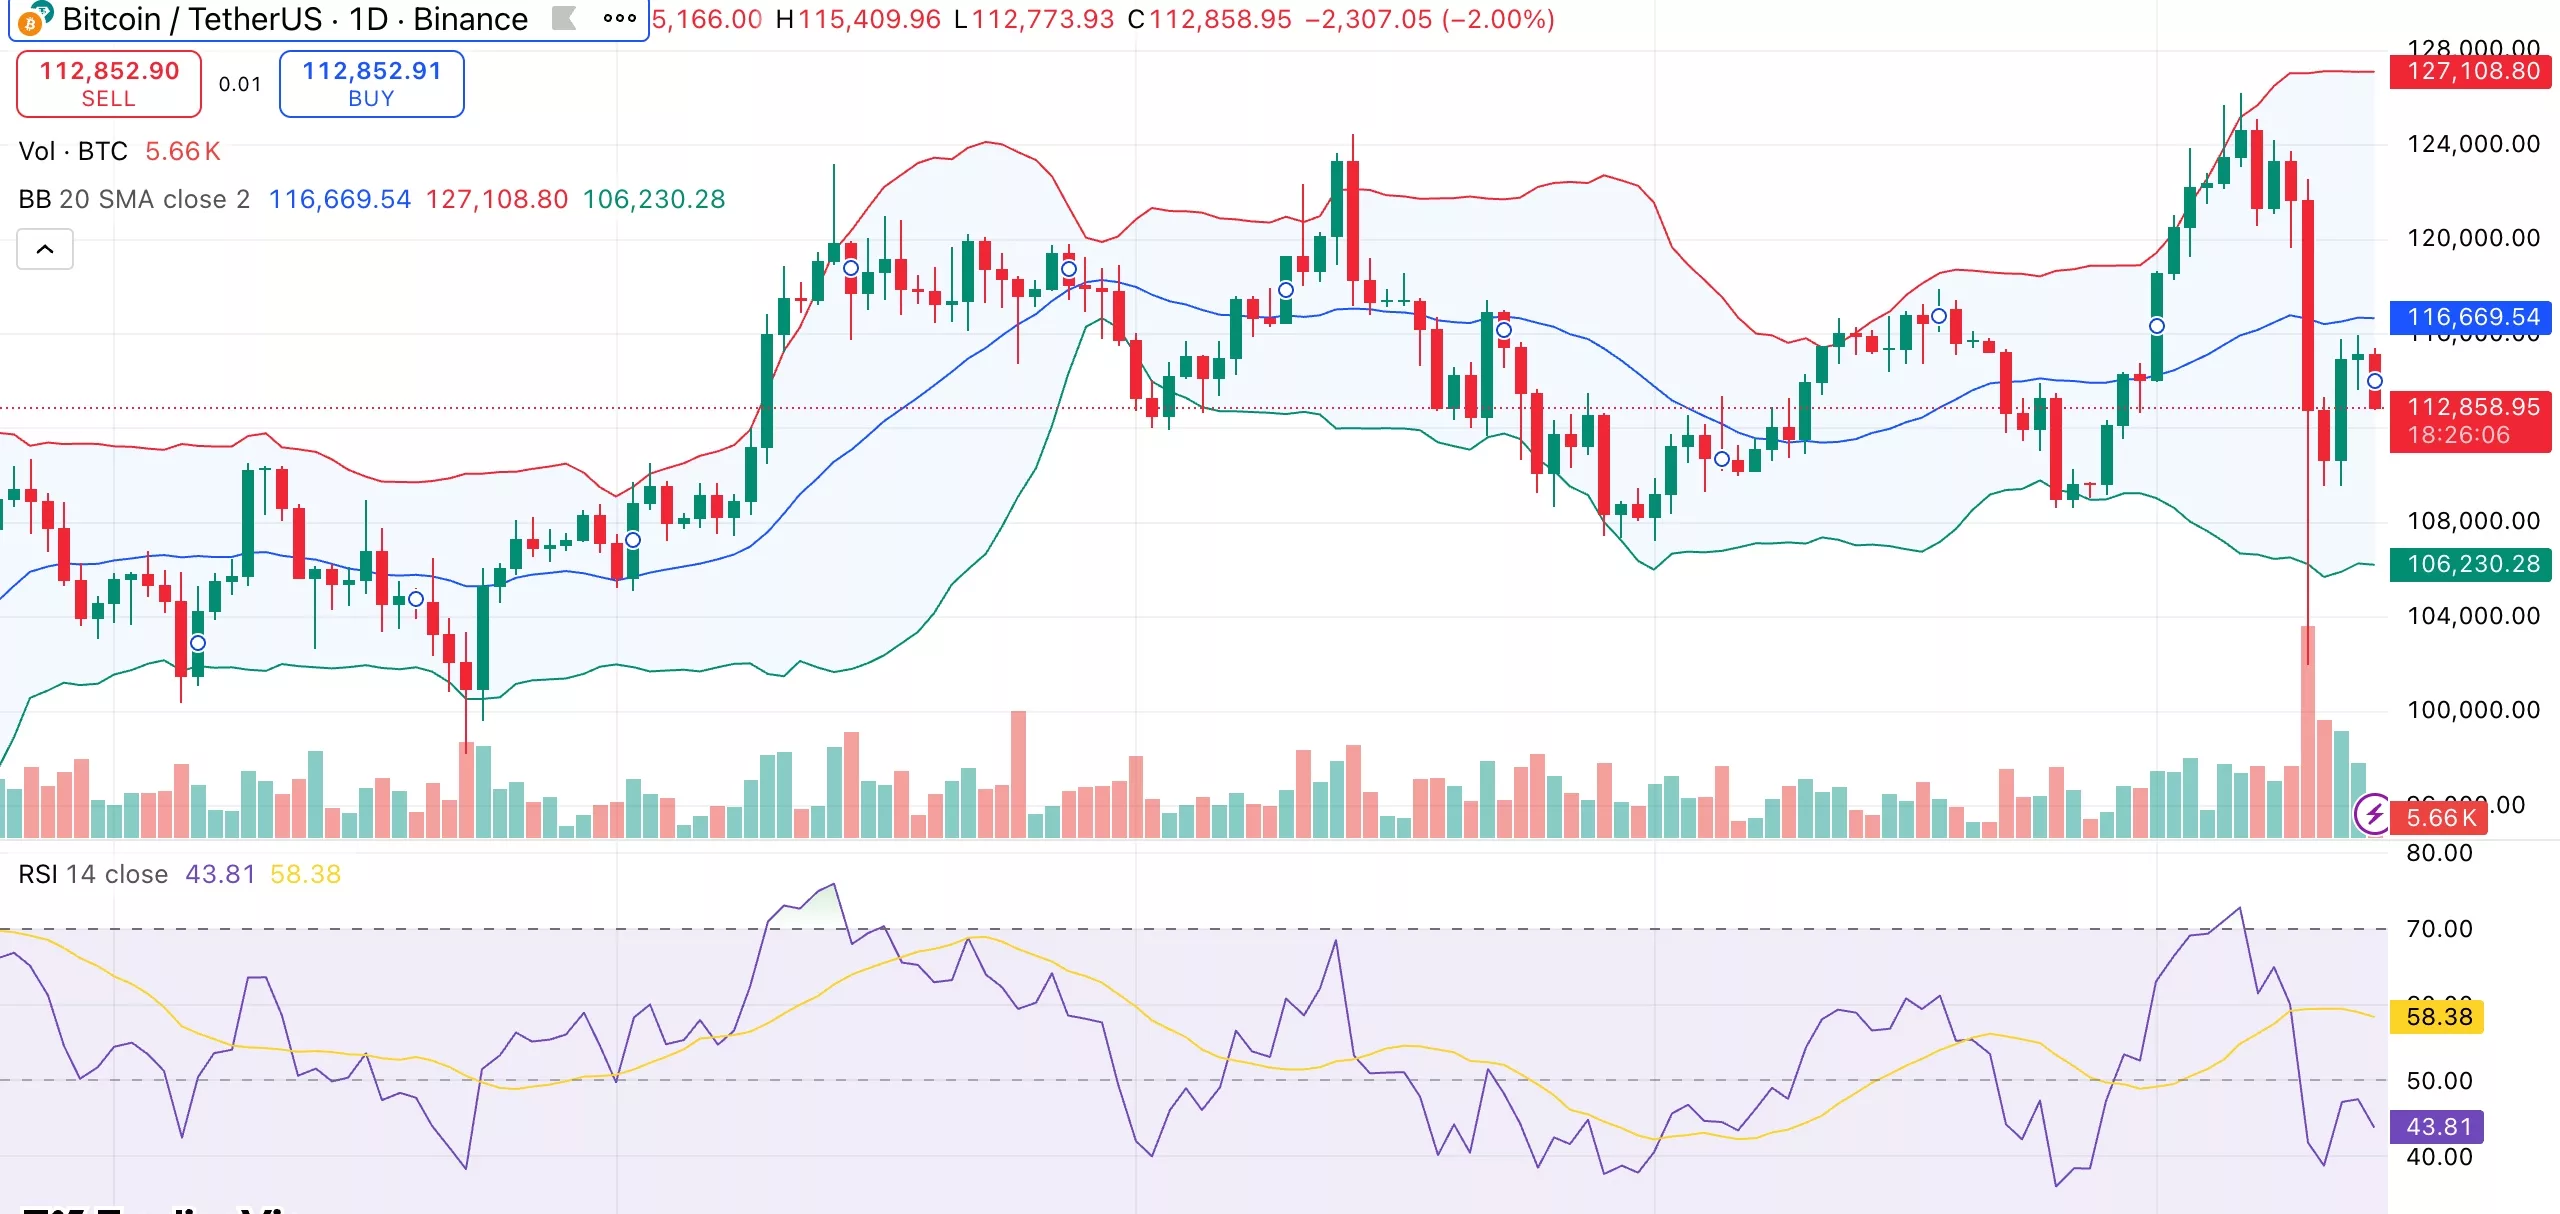
The 200-day averages, around $108,000, act as solid support. As long as Bitcoin holds this area, the long-term structure remains intact.
A break above $116,000 to $118,000 would indicate fresh strength and could open the path back toward $125,000. If prices slip below $110,000, the next test could come near $105,000.


You May Also Like
Federal Reserve expected to slash rates today, here's how it may impact crypto
Market participants are eagerly anticipating at least a 25 basis point (BPS) interest rate cut from the Federal Reserve on Wednesday. The Federal Reserve, the central bank of the United States, is expected to begin slashing interest rates on Wednesday, with analysts expecting a 25 basis point (BPS) cut and a boost to risk asset prices in the long term.Crypto prices are strongly correlated with liquidity cycles, Coin Bureau founder and market analyst Nic Puckrin said. However, while lower interest rates tend to raise asset prices long-term, Puckrin warned of a short-term price correction. “The main risk is that the move is already priced in, Puckrin said, adding, “hope is high and there’s a big chance of a ‘sell the news’ pullback. When that happens, speculative corners, memecoins in particular, are most vulnerable.”Read more

Pi Network KYC Debate Sparks Questions Over Referral Rewards and Transparency