   Key Takeaways:

    Gold was the most stable asset, holding its value during every crisis and recovering the fastest with very low volatility.
    Stocks dropped sharply but bounced back fast, helped by government support and improved confidence once the panic was over.
    Bitcoin wasn’t a real safe haven, falling hard in crises but later delivering the biggest rebounds — except in 2022, when the Terra, Voyager, and FTX crashes slowed its recovery.
    Overall, gold protects best during crises, stocks recover with support, and Bitcoin performs strongest once markets calm down.
Crypto prices recently plunged after new U.S. tariff threats, with Bitcoin dropping around 10% in one day. To see which assets hold up best in times like this, we looked at four past crises — the COVID-19 crash (2020), the rate-hike shock (2022), the U.S. banking stress (2023), and the tariff shock ( April 2025). We compared Gold, Bitcoin, and the S&P 500 to find out which protects value and delivers stronger returns later. Each crisis start (CS) and bottom was marked by the biggest S&P 500 drops and spikes in the VIX fear index. Our analysis shows that in three out of four crises, gold held up best during the panic, but Bitcoin delivered the strongest overall gains once markets stabilized. Here’s what happened in each crisis and how the three assets performed.
Table of Contents
In This Article
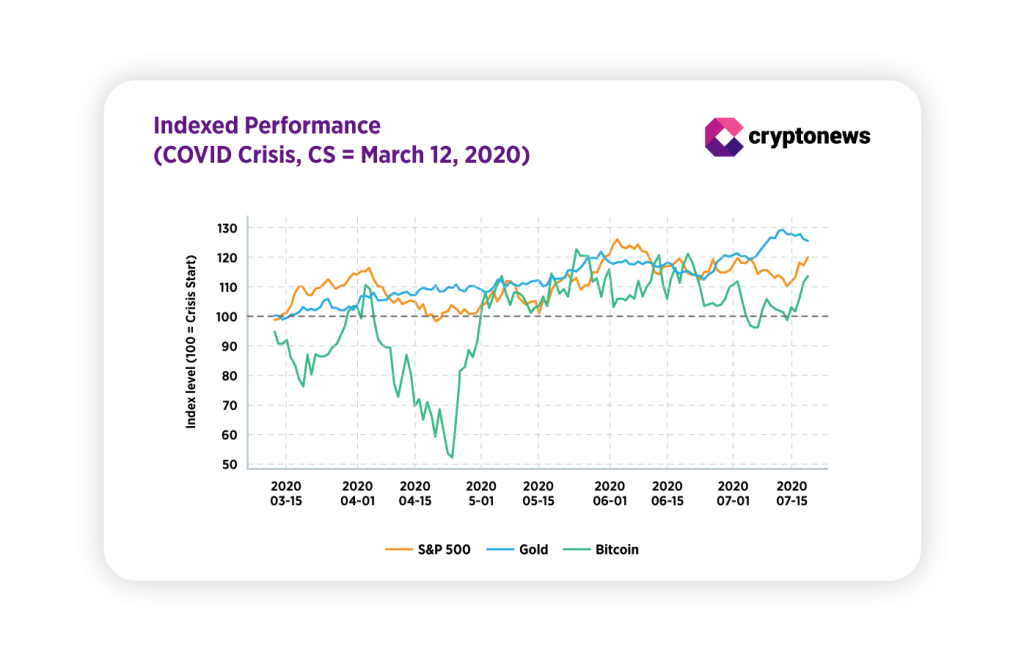
COVID-19 Crisis, March 2020
Here’s What Happened After the Crash
Conclusion: What Worked Better as a Safe Haven
Rate-Hike Shock, 2022
Conclusion: What Worked Better as a Safe Haven
U.S. Regional Banking Stress, March 2023
Conclusion: What Worked Better as a Safe Haven
Tariff Trade Shock, Early April 2025
Conclusion: What Worked Better as a Safe Haven
In This Article
COVID-19 Crisis, March 2020
Here’s What Happened After the Crash
Conclusion: What Worked Better as a Safe Haven
Rate-Hike Shock, 2022
Conclusion: What Worked Better as a Safe Haven
U.S. Regional Banking Stress, March 2023
Conclusion: What Worked Better as a Safe Haven
Show Full Guide
Tariff Trade Shock, Early April 2025
Conclusion: What Worked Better as a Safe Haven
COVID-19 Crisis, March 2020
   In summary:
   Gold was the best safe haven, showing the smallest loss and fastest recovery. Bitcoin fell hardest but later delivered the biggest overall gain, far outperforming both gold and the S&P 500.
Following the global spread of COVID-19, the U.S. declared a national emergency on March 12, 2020, sparking fears of systemic disruption. Global markets reacted with one of the sharpest and fastest sell-offs in modern history.
That day, the S&P 500 fell 9.5% in a single session, its steepest one-day decline since 1987. The VIX Index surged above 75, signaling extreme investor fear. The S&P 500 closed at 2,480.64, formally entering a bear market and marking the true panic inflection point. Forced liquidations rippled across equities, commodities, credit, and crypto.
Here’s What Happened After the Crash
S&P 500: Reclaimed March 12 levels within 3 days. Fully recovered to pre-crisis highs by August 2020.
Gold: Recovered within 3 days and continued its steady climb, gaining +17% over the next six months.
Bitcoin: Required around 2 months to reclaim March 12 levels, but ultimately delivered the strongest rebound, rallying +220% by September 2020.
The table below shows the performance of the S&P 500, Bitcoin, and gold — how many days they took to recover to their February–March 12 level, and their cumulative returns one, three, and six months after the market bottom.Crisis start (CS) is March 12, 2020.
Conclusion: What Worked Better as a Safe Haven
Gold showed the smallest drawdown and the lowest volatility during crisis conditions. It held its value when markets fell and quickly reclaimed pre-crisis levels.
Equities (S&P 500) experienced sharp volatility and steep declines but benefited the fastest from policy support. They sat between gold and Bitcoin, vulnerable during panic but able to rebound quickly.
Bitcoin behaved more like a high-beta risk asset during the panic, suffering severe intraday losses. However, once liquidity returned, it delivered the strongest absolute gains in the recovery phase. BTC outperformed both gold and equities over the following months.
Rate-Hike Shock, 2022
   In summary:
   Gold again proved the most reliable hedge, staying relatively stable and ending higher after six months. Bitcoin acted as a high-risk asset, dropping over 50% and recovering only later, after major crashes like Terra, Voyager, and FTX. Stocks rebounded slowly with policy support.
In 2022, after a decade of low interest rates and quantitative easing, inflation in the U.S. surged above 8%, reaching levels unseen since the early 1980s.
In response, the Federal Reserve initiated an aggressive rate-hike cycle, beginning on March 16, 2022, with a 25 bps increase, the first since 2018.
Throughout 2022, the S&P 500 fell by nearly 25% from its January peak, with its official cycle low occurring on October 12, 2022 (3,577.03). The U.S. 10-year yield surged above 4%, its highest since 2008.
Bitcoin collapsed by more than 50% from its March levels. The decline later deepened by a string of failures, including the collapse of Terra and Luna, the insolvency of Voyager, and, later in the year, the downfall of FTX.
We examined performance from the crisis start (March 16, 2022) to the market bottom (October 12, 2022), and at successive checkpoints one, three, and six months after the bottom.
Below is the Indexed price reaction (100 = Mar 16, 2022). Bitcoin exhibited the deepest fall and the largest rebound from the trough, but remained below the crisis-start level after six months. Gold delivered the most stable path and was the only asset above the CS level after six months.
Bitcoin’s realized volatility was an order of magnitude higher than gold’s. Gold’s volatility remained low.
Conclusion: What Worked Better as a Safe Haven
S&P 500: Although the index rebounded from the October low, it still traded below its March 2022 level six months later. Volatility persisted in the 30–40% range — far above pre-2020 norms — showing how dependent equities were on monetary support.
Gold: Gold outperformed as a defensive asset. Its decline of 13.7% was milder than equities’ but still notable. Initially pressured by rising real yields, it later benefited from safe-haven demand and central-bank accumulation. By April 2023, gold had risen 4.7% above its March 2022 level, confirming its value as a partial hedge once rate-hike expectations stabilized.
Bitcoin: Bitcoin’s 53.4% collapse underscored its extreme sensitivity to liquidity withdrawal. Correlation with equities strengthened through 2022 as crypto behaved like a leveraged tech-risk asset. The downturn was later amplified by a series of failures — starting with Terra and Luna in May, followed by Voyager and eventually FTX. While BTC rebounded 58.6% from its October bottom, it remained 26% below its March 2022 price by April 2023.
U.S. Regional Banking Stress, March 2023
   In summary:
   Gold performed best as a short-term hedge, holding value throughout the panic. The S&P 500 bounced back within a day, while Bitcoin rose even faster but showed higher volatility.
In March 2023, a concentrated episode of U.S. regional-bank stress unfolded over a few days. The sequence of events — Silicon Valley Bank, Signature Bank, and earlier Silvergate — triggered sharp market attention and brief but intense financial-sector strain.
The crisis began on 10 March 2023, when public reports of Silicon Valley Bank’s distress and deposit runs marked the panic inflection point. By 13 March 2023, the S&P 500 had reached its lowest close in the acute window, marking the market bottom of the episode.
Unlike systemic liquidity crises, this event was sectoral (regional banks, deposit flight, contagion fears), and regulators acted quickly to limit contagion. The S&P 500 showed only a modest decline, the VIX spiked into the mid-20s, gold rose as a short-term hedge, and Bitcoin moved higher ahead of the S&P bottom, showing an asynchronous response versus equities.
Here are key daily-close metrics for S&P 500, gold, and Bitcoin, anchored to the crisis start (CS), March 3, 2023, and using the S&P bottom (March 13, 2023) as the event bottom for comparability.
Conclusion: What Worked Better as a Safe Haven
S&P 500. The broad index recovered quickly, reclaiming its crisis-start level within a trading session after the bottom. Rapid, targeted regulatory and Federal Reserve responses limited contagion and supported swift market stabilization.
Gold. Gold worked as a short-term safety asset during the crisis. By the time the S&P 500 hit its lowest point, gold was already trading higher than at the start of the crisis and kept showing positive returns in the following months. Its stable price made it the most reliable short-term safe haven and helped it hold value throughout the recovery.Bitcoin. Bitcoin didn’t act as a traditional safe haven during the crisis. By the time the S&P 500 reached its lowest point, BTC was already trading higher and gained about 49% in the following month. This shows that crypto moved on its own timeline, separate from the stock market. While Bitcoin rose sharply, its big price swings proved that it behaves more like a high-risk asset than a stable refuge in short market shocks.
Tariff Trade Shock, Early April 2025
   In summary:
   Gold remained the most stable asset during the shock, while Bitcoin was the strongest performer afterward, posting the highest six-month returns. Equities recovered quickly once policy uncertainty faded.
On April 2, 2025, the U.S. government announced new tariffs and trade measures. Markets reacted right away — investors grew worried about slower growth, higher inflation, and possible retaliation. Over the next two days, global stocks dropped sharply, with the S&P 500 falling noticeably. The VIX Index jumped to 45, showing a strong rise in fear and short-term market uncertainty.
Equities were the primary losers in percentage terms in the acute days.
Gold was essentially flat to slightly down in the same two-day window (buyers and sellers balancing safe-haven demand and rate/real-yield pressure).
Bitcoin and crypto exhibited idiosyncratic intraday behavior and did not serve as a consistent short-term hedge in this episode (crypto moved asynchronously and was influenced by its own flows).
Conclusion: What Worked Better as a Safe Haven
S&P 500: Stocks dropped the most right after the news, and the VIX spike showed strong fear in the market. After the government clarified its policies, the S&P 500 recovered most of the loss within about two weeks.
Gold: Gold stayed mostly flat at first. That’s typical during policy shocks — people buy gold for safety, but higher interest rates can limit gains. Over time, gold usually benefits if investors stay cautious and growth slows.
Bitcoin: Bitcoin moved on its own during this period. When stocks hit bottom, BTC hadn’t fallen much and didn’t act like a classic safe haven. It behaved more like a risky asset, moving with volatility and separate market flows.
Overall, during this short policy shock, gold was the most stable hedge, stocks fell hardest but recovered fast, and Bitcoin was unpredictable — yet it ended up giving the biggest overall returns once markets calmed.
Disclaimer: Crypto is a high-risk asset class. This article is provided for informational purposes and does not constitute investment advice.
Key Takeaways:
Gold was the most stable asset, holding its value during every crisis and recovering the fastest with very low volatility.
Stocks dropped sharply but bounced back fast, helped by government support and improved confidence once the panic was over.
Bitcoin wasn’t a real safe haven, falling hard in crises but later delivering the biggest rebounds — except in 2022, when the Terra, Voyager, and FTX crashes slowed its recovery.
Overall, gold protects best during crises, stocks recover with support, and Bitcoin performs strongest once markets calm down.
Crypto prices recently plunged after new U.S. tariff threats, with Bitcoin dropping around 10% in one day. To see which assets hold up best in times like this, we looked at four past crises — the COVID-19 crash (2020), the rate-hike shock (2022), the U.S. banking stress (2023), and the tariff shock ( April 2025). We compared Gold, Bitcoin, and the S&P 500 to find out which protects value and delivers stronger returns later. Each crisis start (CS) and bottom was marked by the biggest S&P 500 drops and spikes in the VIX fear index. Our analysis shows that in three out of four crises, gold held up best during the panic, but Bitcoin delivered the strongest overall gains once markets stabilized. Here’s what happened in each crisis and how the three assets performed.
Table of Contents
In This Article
COVID-19 Crisis, March 2020
Here’s What Happened After the Crash
Conclusion: What Worked Better as a Safe Haven
Rate-Hike Shock, 2022
Conclusion: What Worked Better as a Safe Haven
U.S. Regional Banking Stress, March 2023
Conclusion: What Worked Better as a Safe Haven
Tariff Trade Shock, Early April 2025
Conclusion: What Worked Better as a Safe Haven
In This Article
COVID-19 Crisis, March 2020
Here’s What Happened After the Crash
Conclusion: What Worked Better as a Safe Haven
Rate-Hike Shock, 2022
Conclusion: What Worked Better as a Safe Haven
U.S. Regional Banking Stress, March 2023
Conclusion: What Worked Better as a Safe Haven
Show Full Guide
Tariff Trade Shock, Early April 2025
Conclusion: What Worked Better as a Safe Haven
COVID-19 Crisis, March 2020
In summary:
Gold was the best safe haven, showing the smallest loss and fastest recovery. Bitcoin fell hardest but later delivered the biggest overall gain, far outperforming both gold and the S&P 500.
Following the global spread of COVID-19, the U.S. declared a national emergency on March 12, 2020, sparking fears of systemic disruption. Global markets reacted with one of the sharpest and fastest sell-offs in modern history.
That day, the S&P 500 fell 9.5% in a single session, its steepest one-day decline since 1987. The VIX Index surged above 75, signaling extreme investor fear. The S&P 500 closed at 2,480.64, formally entering a bear market and marking the true panic inflection point. Forced liquidations rippled across equities, commodities, credit, and crypto.
Here’s What Happened After the Crash
S&P 500: Reclaimed March 12 levels within 3 days. Fully recovered to pre-crisis highs by August 2020.
Gold: Recovered within 3 days and continued its steady climb, gaining +17% over the next six months.
Bitcoin: Required around 2 months to reclaim March 12 levels, but ultimately delivered the strongest rebound, rallying +220% by September 2020.
The table below shows the performance of the S&P 500, Bitcoin, and gold — how many days they took to recover to their February–March 12 level, and their cumulative returns one, three, and six months after the market bottom.Crisis start (CS) is March 12, 2020.
Conclusion: What Worked Better as a Safe Haven
Gold showed the smallest drawdown and the lowest volatility during crisis conditions. It held its value when markets fell and quickly reclaimed pre-crisis levels.
Equities (S&P 500) experienced sharp volatility and steep declines but benefited the fastest from policy support. They sat between gold and Bitcoin, vulnerable during panic but able to rebound quickly.
Bitcoin behaved more like a high-beta risk asset during the panic, suffering severe intraday losses. However, once liquidity returned, it delivered the strongest absolute gains in the recovery phase. BTC outperformed both gold and equities over the following months.
Rate-Hike Shock, 2022
In summary:
Gold again proved the most reliable hedge, staying relatively stable and ending higher after six months. Bitcoin acted as a high-risk asset, dropping over 50% and recovering only later, after major crashes like Terra, Voyager, and FTX. Stocks rebounded slowly with policy support.
In 2022, after a decade of low interest rates and quantitative easing, inflation in the U.S. surged above 8%, reaching levels unseen since the early 1980s.
In response, the Federal Reserve initiated an aggressive rate-hike cycle, beginning on March 16, 2022, with a 25 bps increase, the first since 2018.
Throughout 2022, the S&P 500 fell by nearly 25% from its January peak, with its official cycle low occurring on October 12, 2022 (3,577.03). The U.S. 10-year yield surged above 4%, its highest since 2008.
Bitcoin collapsed by more than 50% from its March levels. The decline later deepened by a string of failures, including the collapse of Terra and Luna, the insolvency of Voyager, and, later in the year, the downfall of FTX.
We examined performance from the crisis start (March 16, 2022) to the market bottom (October 12, 2022), and at successive checkpoints one, three, and six months after the bottom.
Below is the Indexed price reaction (100 = Mar 16, 2022). Bitcoin exhibited the deepest fall and the largest rebound from the trough, but remained below the crisis-start level after six months. Gold delivered the most stable path and was the only asset above the CS level after six months.
Bitcoin’s realized volatility was an order of magnitude higher than gold’s. Gold’s volatility remained low.
Conclusion: What Worked Better as a Safe Haven
S&P 500: Although the index rebounded from the October low, it still traded below its March 2022 level six months later. Volatility persisted in the 30–40% range — far above pre-2020 norms — showing how dependent equities were on monetary support.
Gold: Gold outperformed as a defensive asset. Its decline of 13.7% was milder than equities’ but still notable. Initially pressured by rising real yields, it later benefited from safe-haven demand and central-bank accumulation. By April 2023, gold had risen 4.7% above its March 2022 level, confirming its value as a partial hedge once rate-hike expectations stabilized.
Bitcoin: Bitcoin’s 53.4% collapse underscored its extreme sensitivity to liquidity withdrawal. Correlation with equities strengthened through 2022 as crypto behaved like a leveraged tech-risk asset. The downturn was later amplified by a series of failures — starting with Terra and Luna in May, followed by Voyager and eventually FTX. While BTC rebounded 58.6% from its October bottom, it remained 26% below its March 2022 price by April 2023.
U.S. Regional Banking Stress, March 2023
In summary:
Gold performed best as a short-term hedge, holding value throughout the panic. The S&P 500 bounced back within a day, while Bitcoin rose even faster but showed higher volatility.
In March 2023, a concentrated episode of U.S. regional-bank stress unfolded over a few days. The sequence of events — Silicon Valley Bank, Signature Bank, and earlier Silvergate — triggered sharp market attention and brief but intense financial-sector strain.
The crisis began on 10 March 2023, when public reports of Silicon Valley Bank’s distress and deposit runs marked the panic inflection point. By 13 March 2023, the S&P 500 had reached its lowest close in the acute window, marking the market bottom of the episode.
Unlike systemic liquidity crises, this event was sectoral (regional banks, deposit flight, contagion fears), and regulators acted quickly to limit contagion. The S&P 500 showed only a modest decline, the VIX spiked into the mid-20s, gold rose as a short-term hedge, and Bitcoin moved higher ahead of the S&P bottom, showing an asynchronous response versus equities.
Here are key daily-close metrics for S&P 500, gold, and Bitcoin, anchored to the crisis start (CS), March 3, 2023, and using the S&P bottom (March 13, 2023) as the event bottom for comparability.
Conclusion: What Worked Better as a Safe Haven
S&P 500. The broad index recovered quickly, reclaiming its crisis-start level within a trading session after the bottom. Rapid, targeted regulatory and Federal Reserve responses limited contagion and supported swift market stabilization.
Gold. Gold worked as a short-term safety asset during the crisis. By the time the S&P 500 hit its lowest point, gold was already trading higher than at the start of the crisis and kept showing positive returns in the following months. Its stable price made it the most reliable short-term safe haven and helped it hold value throughout the recovery.Bitcoin. Bitcoin didn’t act as a traditional safe haven during the crisis. By the time the S&P 500 reached its lowest point, BTC was already trading higher and gained about 49% in the following month. This shows that crypto moved on its own timeline, separate from the stock market. While Bitcoin rose sharply, its big price swings proved that it behaves more like a high-risk asset than a stable refuge in short market shocks.
Tariff Trade Shock, Early April 2025
In summary:
Gold remained the most stable asset during the shock, while Bitcoin was the strongest performer afterward, posting the highest six-month returns. Equities recovered quickly once policy uncertainty faded.
On April 2, 2025, the U.S. government announced new tariffs and trade measures. Markets reacted right away — investors grew worried about slower growth, higher inflation, and possible retaliation. Over the next two days, global stocks dropped sharply, with the S&P 500 falling noticeably. The VIX Index jumped to 45, showing a strong rise in fear and short-term market uncertainty.
Equities were the primary losers in percentage terms in the acute days.
Gold was essentially flat to slightly down in the same two-day window (buyers and sellers balancing safe-haven demand and rate/real-yield pressure).
Bitcoin and crypto exhibited idiosyncratic intraday behavior and did not serve as a consistent short-term hedge in this episode (crypto moved asynchronously and was influenced by its own flows).
Conclusion: What Worked Better as a Safe Haven
S&P 500: Stocks dropped the most right after the news, and the VIX spike showed strong fear in the market. After the government clarified its policies, the S&P 500 recovered most of the loss within about two weeks.
Gold: Gold stayed mostly flat at first. That’s typical during policy shocks — people buy gold for safety, but higher interest rates can limit gains. Over time, gold usually benefits if investors stay cautious and growth slows.
Bitcoin: Bitcoin moved on its own during this period. When stocks hit bottom, BTC hadn’t fallen much and didn’t act like a classic safe haven. It behaved more like a risky asset, moving with volatility and separate market flows.
Overall, during this short policy shock, gold was the most stable hedge, stocks fell hardest but recovered fast, and Bitcoin was unpredictable — yet it ended up giving the biggest overall returns once markets calmed.
Disclaimer: Crypto is a high-risk asset class. This article is provided for informational purposes and does not constitute investment advice.
Key Takeaways:
- Gold was the most stable asset, holding its value during every crisis and recovering the fastest with very low volatility.
- Stocks dropped sharply but bounced back fast, helped by government support and improved confidence once the panic was over.
- Bitcoin wasn’t a real safe haven, falling hard in crises but later delivering the biggest rebounds — except in 2022, when the Terra, Voyager, and FTX crashes slowed its recovery.
- Overall, gold protects best during crises, stocks recover with support, and Bitcoin performs strongest once markets calm down.
Crypto prices recently plunged after new U.S. tariff threats, with Bitcoin dropping around 10% in one day. To see which assets hold up best in times like this, we looked at four past crises — the COVID-19 crash (2020), the rate-hike shock (2022), the U.S. banking stress (2023), and the tariff shock ( April 2025). We compared Gold, Bitcoin, and the S&P 500 to find out which protects value and delivers stronger returns later. Each crisis start (CS) and bottom was marked by the biggest S&P 500 drops and spikes in the VIX fear index. Our analysis shows that in three out of four crises, gold held up best during the panic, but Bitcoin delivered the strongest overall gains once markets stabilized. Here’s what happened in each crisis and how the three assets performed.
Table of Contents
- In This Article
-
COVID-19 Crisis, March 2020
- Here’s What Happened After the Crash
- Conclusion: What Worked Better as a Safe Haven
-
Rate-Hike Shock, 2022
- Conclusion: What Worked Better as a Safe Haven
-
U.S. Regional Banking Stress, March 2023
- Conclusion: What Worked Better as a Safe Haven
-
Tariff Trade Shock, Early April 2025
- Conclusion: What Worked Better as a Safe Haven
- In This Article
-
COVID-19 Crisis, March 2020
- Here’s What Happened After the Crash
- Conclusion: What Worked Better as a Safe Haven
-
Rate-Hike Shock, 2022
- Conclusion: What Worked Better as a Safe Haven
-
U.S. Regional Banking Stress, March 2023
- Conclusion: What Worked Better as a Safe Haven
- Show Full Guide
-
Tariff Trade Shock, Early April 2025
- Conclusion: What Worked Better as a Safe Haven
COVID-19 Crisis, March 2020
In summary:
Gold was the best safe haven, showing the smallest loss and fastest recovery. Bitcoin fell hardest but later delivered the biggest overall gain, far outperforming both gold and the S&P 500.
Following the global spread of COVID-19, the U.S. declared a national emergency on March 12, 2020, sparking fears of systemic disruption. Global markets reacted with one of the sharpest and fastest sell-offs in modern history.
That day, the S&P 500 fell 9.5% in a single session, its steepest one-day decline since 1987. The VIX Index surged above 75, signaling extreme investor fear. The S&P 500 closed at 2,480.64, formally entering a bear market and marking the true panic inflection point. Forced liquidations rippled across equities, commodities, credit, and crypto.
Here’s What Happened After the Crash
- S&P 500: Reclaimed March 12 levels within 3 days. Fully recovered to pre-crisis highs by August 2020.
- Gold: Recovered within 3 days and continued its steady climb, gaining +17% over the next six months.
- Bitcoin: Required around 2 months to reclaim March 12 levels, but ultimately delivered the strongest rebound, rallying +220% by September 2020.
The table below shows the performance of the S&P 500, Bitcoin, and gold — how many days they took to recover to their February–March 12 level, and their cumulative returns one, three, and six months after the market bottom.

Crisis start (CS) is March 12, 2020.
Conclusion: What Worked Better as a Safe Haven
Gold showed the smallest drawdown and the lowest volatility during crisis conditions. It held its value when markets fell and quickly reclaimed pre-crisis levels.
Equities (S&P 500) experienced sharp volatility and steep declines but benefited the fastest from policy support. They sat between gold and Bitcoin, vulnerable during panic but able to rebound quickly.
Bitcoin behaved more like a high-beta risk asset during the panic, suffering severe intraday losses. However, once liquidity returned, it delivered the strongest absolute gains in the recovery phase. BTC outperformed both gold and equities over the following months.
Rate-Hike Shock, 2022
In summary:
Gold again proved the most reliable hedge, staying relatively stable and ending higher after six months. Bitcoin acted as a high-risk asset, dropping over 50% and recovering only later, after major crashes like Terra, Voyager, and FTX. Stocks rebounded slowly with policy support.
In 2022, after a decade of low interest rates and quantitative easing, inflation in the U.S. surged above 8%, reaching levels unseen since the early 1980s.
In response, the Federal Reserve initiated an aggressive rate-hike cycle, beginning on March 16, 2022, with a 25 bps increase, the first since 2018.
Throughout 2022, the S&P 500 fell by nearly 25% from its January peak, with its official cycle low occurring on October 12, 2022 (3,577.03). The U.S. 10-year yield surged above 4%, its highest since 2008.
Bitcoin collapsed by more than 50% from its March levels. The decline later deepened by a string of failures, including the collapse of Terra and Luna, the insolvency of Voyager, and, later in the year, the downfall of FTX.
We examined performance from the crisis start (March 16, 2022) to the market bottom (October 12, 2022), and at successive checkpoints one, three, and six months after the bottom.
Below is the Indexed price reaction (100 = Mar 16, 2022). Bitcoin exhibited the deepest fall and the largest rebound from the trough, but remained below the crisis-start level after six months. Gold delivered the most stable path and was the only asset above the CS level after six months.
Bitcoin’s realized volatility was an order of magnitude higher than gold’s. Gold’s volatility remained low.
Conclusion: What Worked Better as a Safe Haven
S&P 500: Although the index rebounded from the October low, it still traded below its March 2022 level six months later. Volatility persisted in the 30–40% range — far above pre-2020 norms — showing how dependent equities were on monetary support.
Gold: Gold outperformed as a defensive asset. Its decline of 13.7% was milder than equities’ but still notable. Initially pressured by rising real yields, it later benefited from safe-haven demand and central-bank accumulation. By April 2023, gold had risen 4.7% above its March 2022 level, confirming its value as a partial hedge once rate-hike expectations stabilized.
Bitcoin: Bitcoin’s 53.4% collapse underscored its extreme sensitivity to liquidity withdrawal. Correlation with equities strengthened through 2022 as crypto behaved like a leveraged tech-risk asset. The downturn was later amplified by a series of failures — starting with Terra and Luna in May, followed by Voyager and eventually FTX. While BTC rebounded 58.6% from its October bottom, it remained 26% below its March 2022 price by April 2023.
U.S. Regional Banking Stress, March 2023
In summary:
Gold performed best as a short-term hedge, holding value throughout the panic. The S&P 500 bounced back within a day, while Bitcoin rose even faster but showed higher volatility.
In March 2023, a concentrated episode of U.S. regional-bank stress unfolded over a few days. The sequence of events — Silicon Valley Bank, Signature Bank, and earlier Silvergate — triggered sharp market attention and brief but intense financial-sector strain.
The crisis began on 10 March 2023, when public reports of Silicon Valley Bank’s distress and deposit runs marked the panic inflection point. By 13 March 2023, the S&P 500 had reached its lowest close in the acute window, marking the market bottom of the episode.
Unlike systemic liquidity crises, this event was sectoral (regional banks, deposit flight, contagion fears), and regulators acted quickly to limit contagion. The S&P 500 showed only a modest decline, the VIX spiked into the mid-20s, gold rose as a short-term hedge, and Bitcoin moved higher ahead of the S&P bottom, showing an asynchronous response versus equities.
Here are key daily-close metrics for S&P 500, gold, and Bitcoin, anchored to the crisis start (CS), March 3, 2023, and using the S&P bottom (March 13, 2023) as the event bottom for comparability.
Conclusion: What Worked Better as a Safe Haven
S&P 500. The broad index recovered quickly, reclaiming its crisis-start level within a trading session after the bottom. Rapid, targeted regulatory and Federal Reserve responses limited contagion and supported swift market stabilization.
Gold. Gold worked as a short-term safety asset during the crisis. By the time the S&P 500 hit its lowest point, gold was already trading higher than at the start of the crisis and kept showing positive returns in the following months. Its stable price made it the most reliable short-term safe haven and helped it hold value throughout the recovery.
Bitcoin. Bitcoin didn’t act as a traditional safe haven during the crisis. By the time the S&P 500 reached its lowest point, BTC was already trading higher and gained about 49% in the following month. This shows that crypto moved on its own timeline, separate from the stock market. While Bitcoin rose sharply, its big price swings proved that it behaves more like a high-risk asset than a stable refuge in short market shocks.
Tariff Trade Shock, Early April 2025
In summary:
Gold remained the most stable asset during the shock, while Bitcoin was the strongest performer afterward, posting the highest six-month returns. Equities recovered quickly once policy uncertainty faded.
On April 2, 2025, the U.S. government announced new tariffs and trade measures. Markets reacted right away — investors grew worried about slower growth, higher inflation, and possible retaliation. Over the next two days, global stocks dropped sharply, with the S&P 500 falling noticeably. The VIX Index jumped to 45, showing a strong rise in fear and short-term market uncertainty.
- Equities were the primary losers in percentage terms in the acute days.
- Gold was essentially flat to slightly down in the same two-day window (buyers and sellers balancing safe-haven demand and rate/real-yield pressure).
- Bitcoin and crypto exhibited idiosyncratic intraday behavior and did not serve as a consistent short-term hedge in this episode (crypto moved asynchronously and was influenced by its own flows).
Conclusion: What Worked Better as a Safe Haven
S&P 500: Stocks dropped the most right after the news, and the VIX spike showed strong fear in the market. After the government clarified its policies, the S&P 500 recovered most of the loss within about two weeks.
Gold: Gold stayed mostly flat at first. That’s typical during policy shocks — people buy gold for safety, but higher interest rates can limit gains. Over time, gold usually benefits if investors stay cautious and growth slows.
Bitcoin: Bitcoin moved on its own during this period. When stocks hit bottom, BTC hadn’t fallen much and didn’t act like a classic safe haven. It behaved more like a risky asset, moving with volatility and separate market flows.
Overall, during this short policy shock, gold was the most stable hedge, stocks fell hardest but recovered fast, and Bitcoin was unpredictable — yet it ended up giving the biggest overall returns once markets calmed.
Disclaimer: Crypto is a high-risk asset class. This article is provided for informational purposes and does not constitute investment advice.
Disclaimer: The articles reposted on this site are sourced from public platforms and are provided for informational purposes only. They do not necessarily reflect the views of MEXC. All rights remain with the original authors. If you believe any content infringes on third-party rights, please contact
crypto.news@mexc.com for removal. MEXC makes no guarantees regarding the accuracy, completeness, or timeliness of the content and is not responsible for any actions taken based on the information provided. The content does not constitute financial, legal, or other professional advice, nor should it be considered a recommendation or endorsement by MEXC.