

Crypto liquidations near $2 billion as bitcoin rout deepens
Crypto markets faced another massive washout on Friday, with almost $2 billion in leveraged positions liquidated as Bitcoin plunged as low as $82,000. The collapse pushed total crypto market capitalization down to roughly $2.9 trillion, marking its first break below the $3 trillion threshold since spring.
CoinGlass data shows that more than 396,000 traders were wiped out, with the single-largest order — a $36.78 million BTC-USD position — taken out on the Hyperliquid decentralized exchange.
However, it’s important to note that liquidation data remains imperfect. Bybit publishes full real-time figures, but venues like Binance and OKX only provide partial or delayed liquidation reporting. As a result, headline numbers likely understate the full scale of forced unwinds.
ETF outflows deepen as liquidity evaporates
The latest cascade follows back-to-back blowups this month amid accelerating ETF outflows and mixed macro sentiment, sending BTC to fresh multi-month lows.
As The Block reported, bitcoin ETFs saw $903 million in net outflows on Thursday — the second largest since their launch. Analysts opined that Wall Street redemptions fueled the drawdown.
Bitcoin is down more than 30% from its October all-time high and is now on pace for its worst monthly performance since the 2022 collapse. It is also tracking for its weakest Q4 since 2018 — an unusual reversal for a quarter that historically delivers the strongest crypto returns.
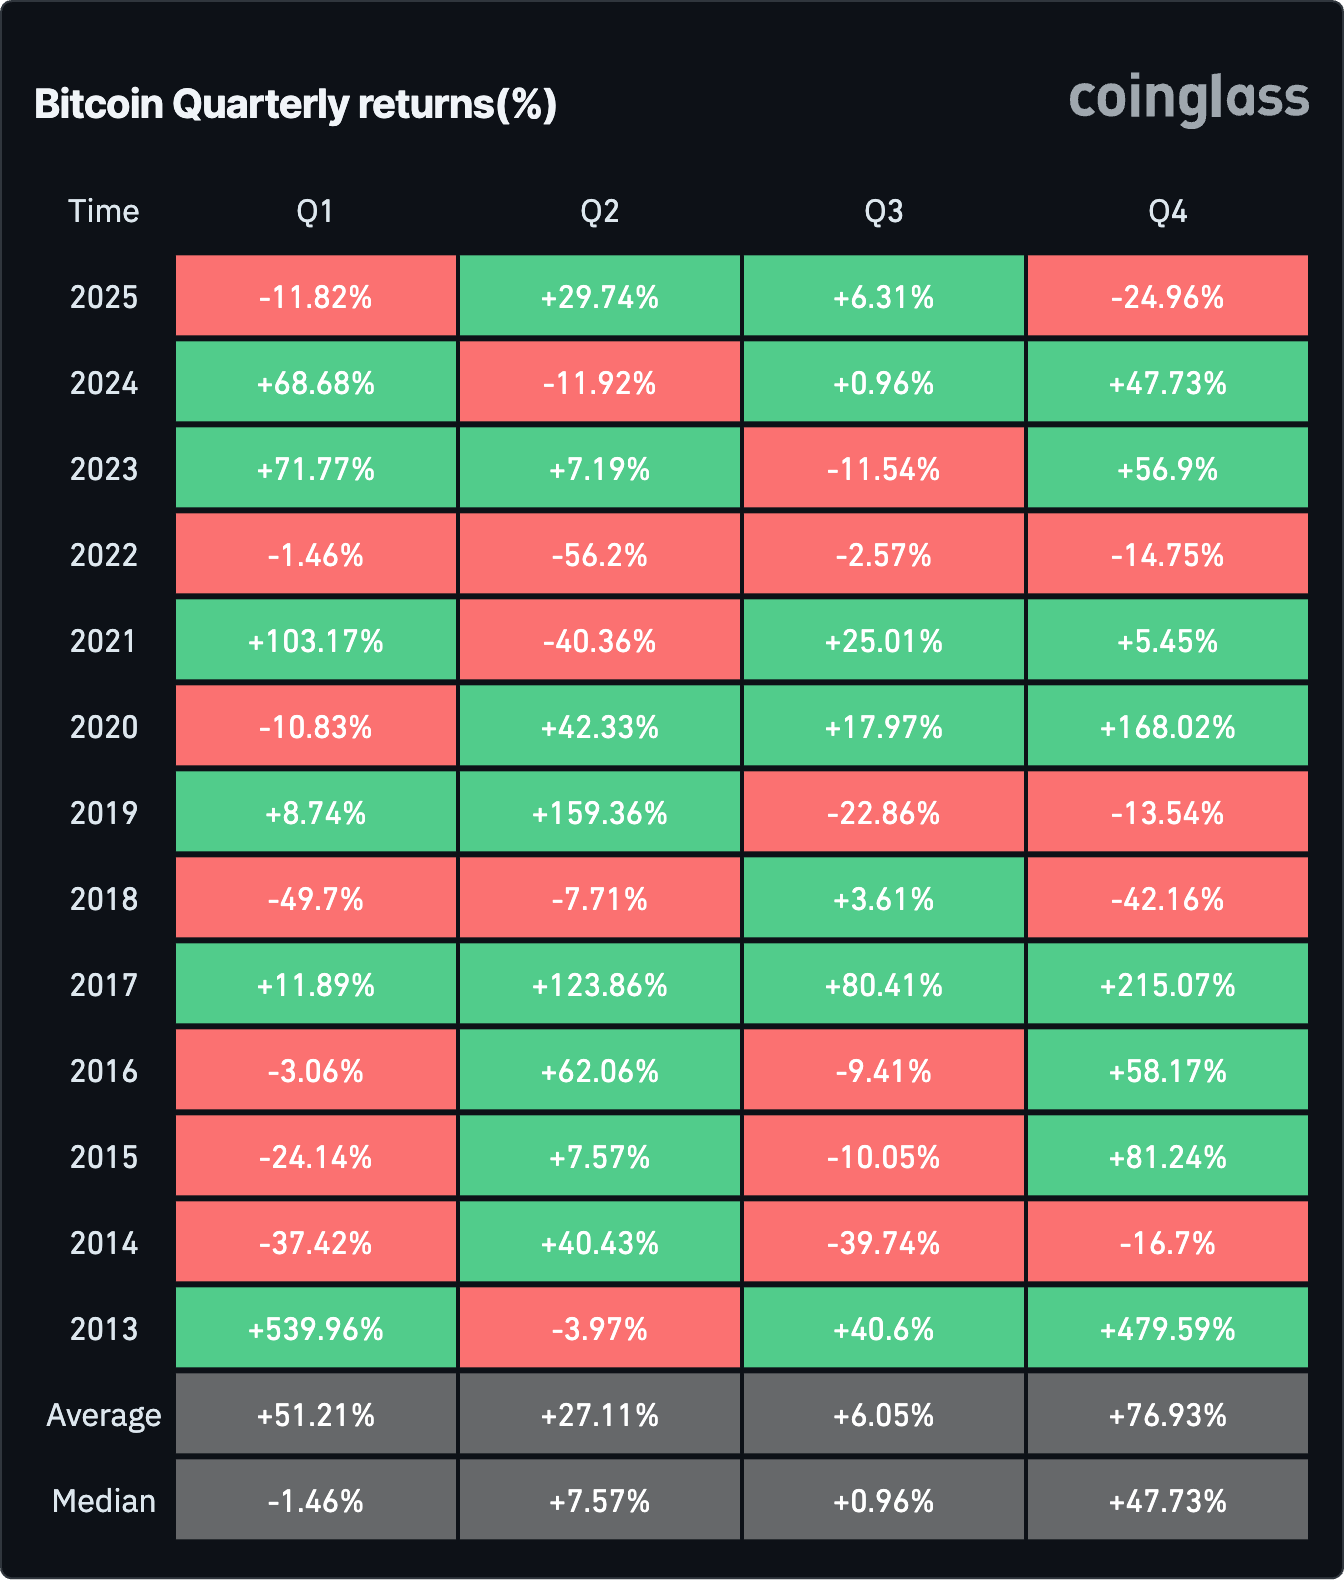
Bitcoin Quarterly returns | Image: CoinGlass
According to BRN's Head of Research Timothy Misir, Friday’s slide pushed the Fear & Greed Index to 11, signaling "extreme distress." Misir noted liquidity "thinning into a full-scale vacuum" as the broader crypto market slipped into lows from the second quarter of 2025.
Bitcoin’s break below the Active Investors Mean shifts focus to the True Market Mean at $81.9K — a long-observed cost-basis cluster he described as "the next major line before full bear confirmation."
"Bitcoin is now in the capitulation zone, and the market is trading through forced liquidation rather than rationale," Misir wrote. "Holders are bleeding out, which historically precedes sharp rebounds, but timing hinges on whether institutional flows reappear. Until then, defense remains the only rational stance."
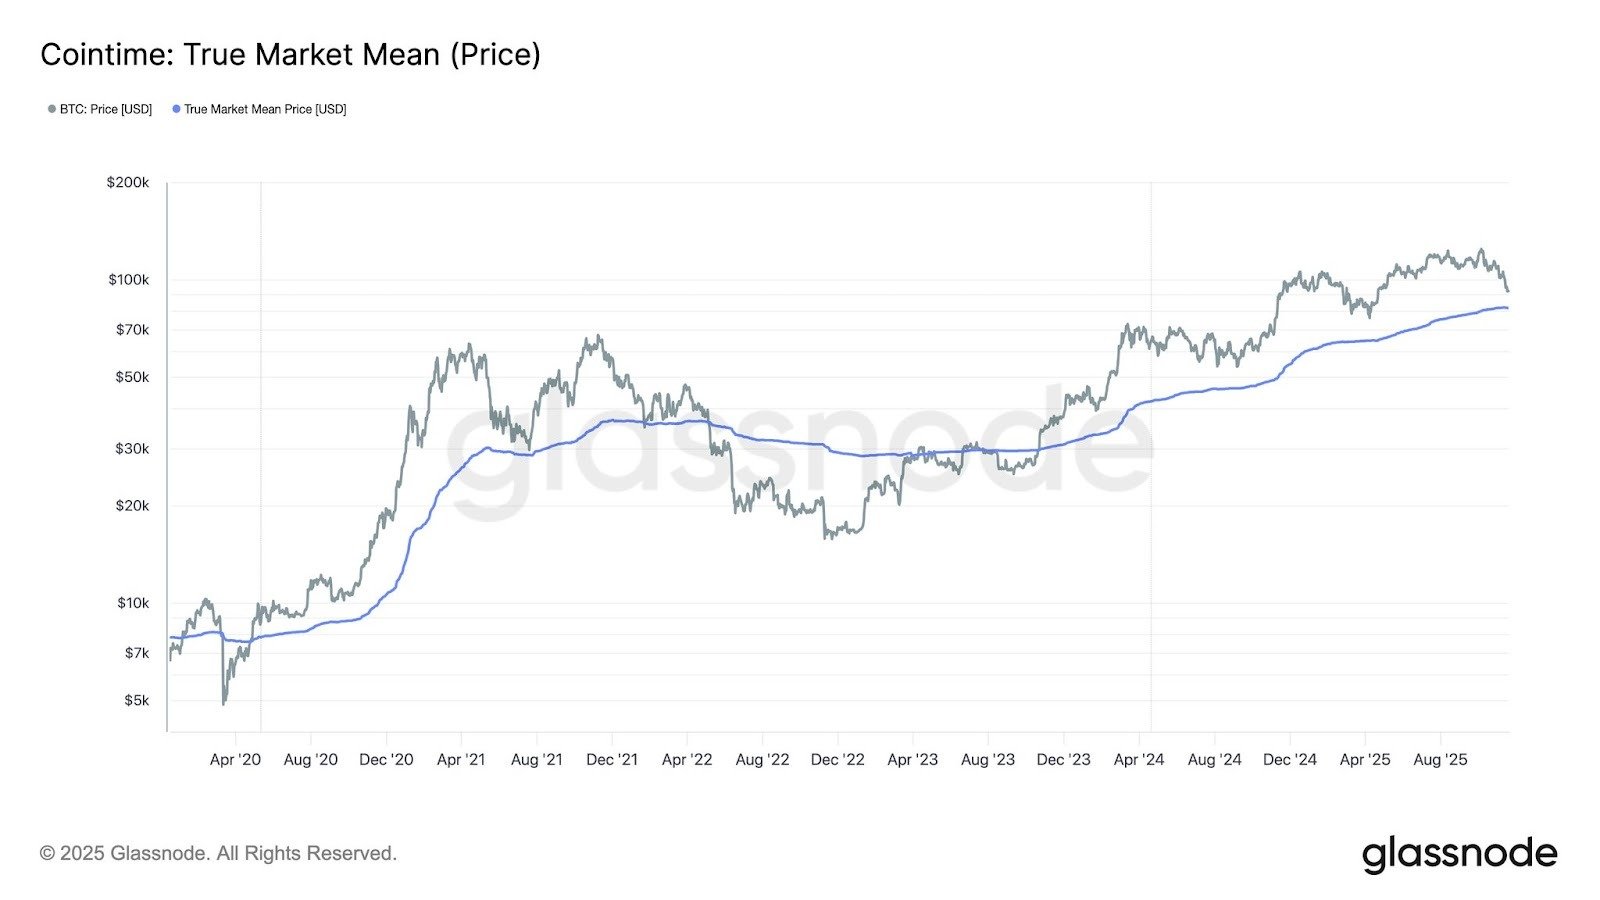
Bitcoin True Market Mean Price | Image: Glassnode
Mixed macro adds pressure, not relief
U.S. jobs data earlier this week showed a surprise 119,000-job increase, softening recession fears but complicating expectations for a December rate cut.
Markets were further whipsawed by new remarks from Kevin Hassett — the White House’s nominee for Federal Reserve Chair — who reportedly said pausing cuts would be "a very bad time," citing cooling inflation and the growth drag from the government shutdown.
Japan’s $135 billion stimulus package added some global support, but not enough to offset the crypto-native deleveraging wave already underway.
"Macro is constructive, but crypto is trading almost entirely on internal flows and liquidation pressure," Misir said.
Onchain data shows short-term holders are realizing losses at "cycle-comparable extremes." BRN notes these realized-loss spikes now mirror those seen during the sharpest corrections of 2021 and mid-2024.
"Either we’re nearing a final capitulation before a sharp reclaim, or this is the moment a bullish regime fully breaks," Misir said. He stated that a failure to retake the $88,000–$90,000 band "opens a direct path" to high-liquidity zones around $78,000–$82,000.
Where the cycle's 'max-pain' may sit
Another closely watched external marker entered the conversation on Friday as institutional experts tried to contextualize the drawdown.
Bitwise Europe research head Andre Dragosch said Bitcoin may be approaching what he called a “max-pain” zone — areas where the largest institutional cost bases sit and where forced sellers typically exhaust themselves.
Dragosch pointed to two anchor levels that, in his view, define the range where a full "max-pain" reset could occur. He noted that Bitcoin’s $84,000 area roughly aligns with the average cost basis of BlackRock’s IBIT, the largest spot bitcoin ETF in the U.S. A decisive move below that zone would represent the point at which the biggest ETF cohort is underwater. It’s also historically where forced sellers tend to exhaust themselves, he said.
Dragosch added that the lower boundary of this range sits closer to $73,000, which approximates MicroStrategy’s overall cost basis. According to his post on X, a test of either level — or a bottom forming somewhere between them — would resemble a classic cycle clear out and likely mark the moment when capitulation gives way to structural recovery.
"Think max max pain is reached the moment we tag either the IBIT cost basis at 84k or MSTR cost basis at 73k,” he said. “Very likely we’ll see a final bottom somewhere in between. But these will be fire-sale prices and akin to a full cycle reset in my view."
BTC traded around $82,500, down almost 10% in the last 24 hours, according to The Block's price page. Major altcoins, including ether, SOL, and BNB, also posted double-digit losses amid a broad market slump.
Disclaimer: The Block is an independent media outlet that delivers news, research, and data. As of November 2023, Foresight Ventures is a majority investor of The Block. Foresight Ventures invests in other companies in the crypto space. Crypto exchange Bitget is an anchor LP for Foresight Ventures. The Block continues to operate independently to deliver objective, impactful, and timely information about the crypto industry. Here are our current financial disclosures.
© 2025 The Block. All Rights Reserved. This article is provided for informational purposes only. It is not offered or intended to be used as legal, tax, investment, financial, or other advice.
You May Also Like

WHY RURAL POWER GRIDS ARE EMERGING AS A CRITICAL FRONT LINE IN CYBERSECURITY

OpenAI Plans to Merge ChatGPT, Codex and Atlas Into One ‘Superapp’: WSJ

