

XRP: can the pair stabilize after the latest bearish washout?
 XRP/ USDT has slipped into a fragile phase where longer-term sellers still dominate, yet short-term price action hints at the first attempts at stabilization.
In this piece we will connect daily and intraday signals to understand whether the current pressure is just another leg in a broader downtrend or the early groundwork for a base.
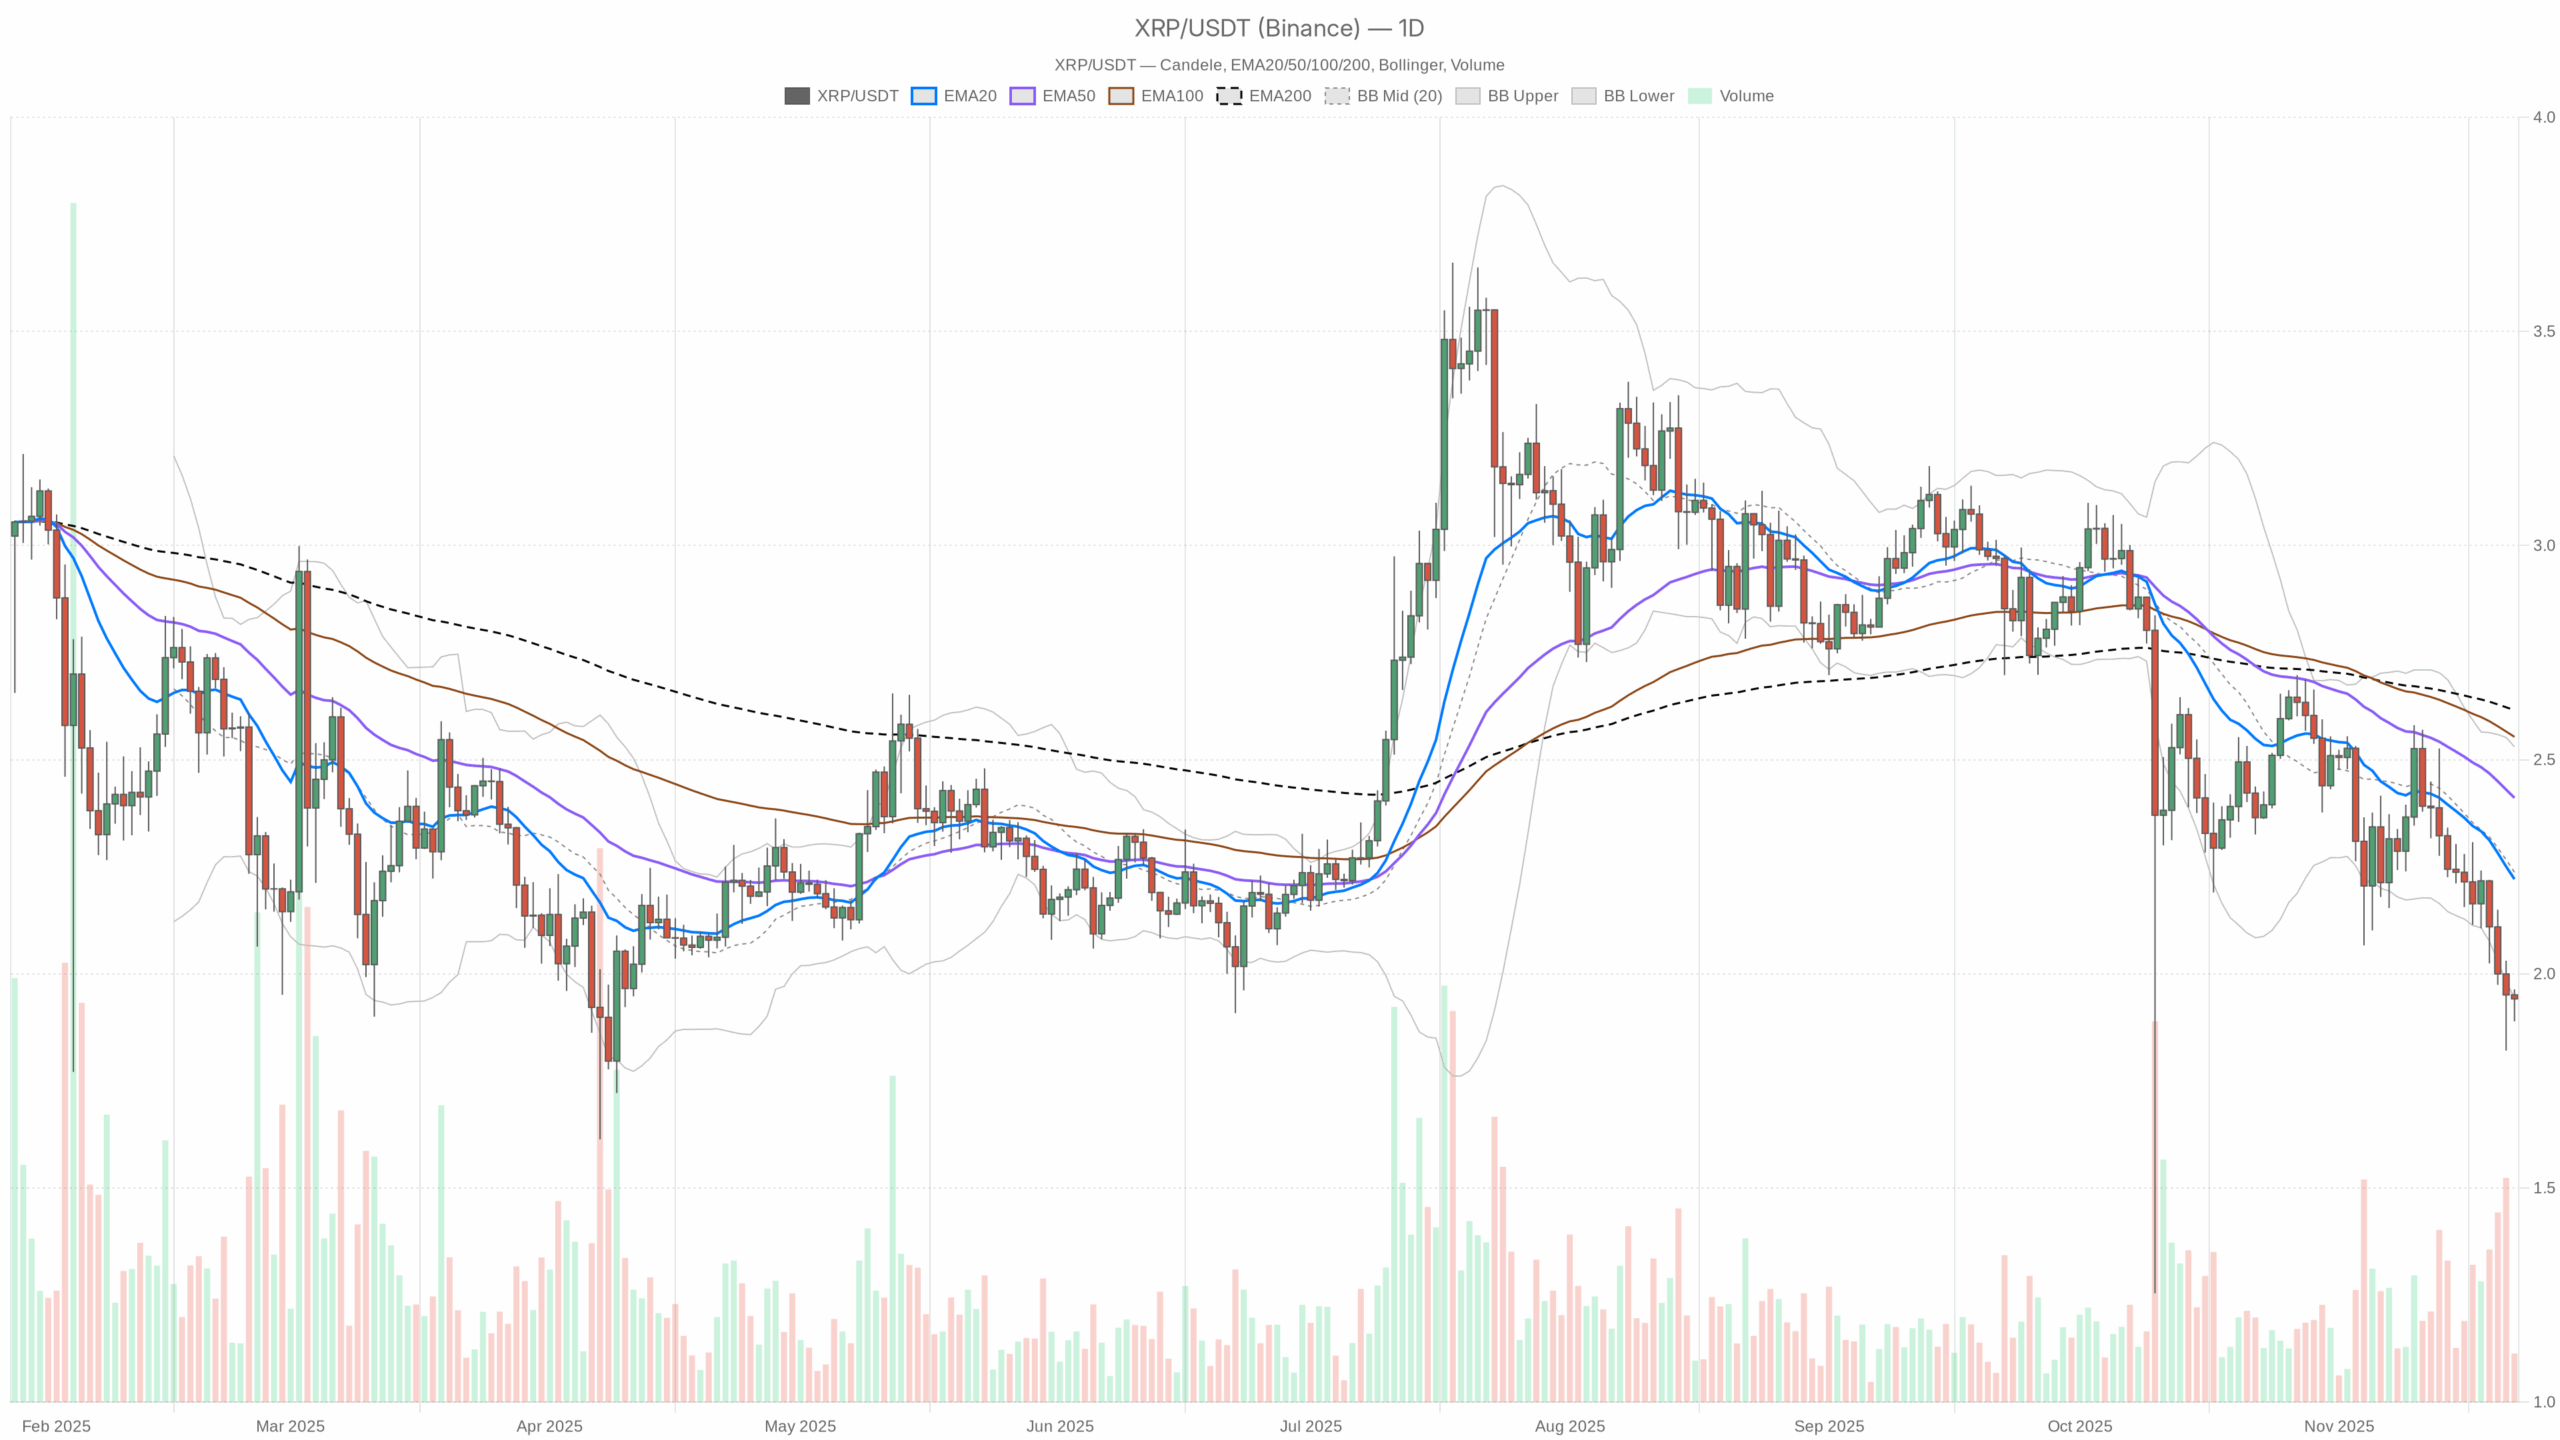 XRP/USDT — daily chart with candlesticks, EMA20/EMA50 and volume.
Summary
The daily chart points to a clear bearish market regime, with the price trading below all major moving averages. Momentum on the higher timeframe remains weak, as daily RSI hovers near oversold territory and MACD is still negative.
However, intraday structures on the hourly and 15minute charts have shifted toward neutrality, suggesting that immediate selling aggression has cooled. Volatility is contained, and average true range readings show no disorderly capitulation. Meanwhile, the wider crypto market is slightly down on the day, and sentiment is dominated by extreme fear. Overall, the environment favors cautious, tactical trading rather than aggressive trend-following.
Market Context and Direction
The broader market backdrop is not providing much support for risk assets. Total crypto capitalization sits around $2.98 trillion, edging lower by a modest 0.14% over the last 24 hours. That mild contraction in value comes as Bitcoin dominance climbs to about 56.8%, underscoring a classic defensive rotation where capital shelters in the largest coin rather than flowing into secondary names. In such phases, underperformers often struggle to attract new bids.
Sentiment indicators reinforce this cautious mood. The Fear & Greed Index stands at 11, classified as Extreme Fear, highlighting that investors remain highly risk-averse. That said, extreme fear can also precede medium-term turning points when selling becomes exhausted. For now, though, the macro context leans toward preservation of capital, and any rebound is likely to be challenged by a market still positioned defensively.
Technical Outlook: XRP reading the overall setup
On the daily timeframe, the pair closes at 1.94, firmly below the 20day EMA at 2.22, the 50day EMA at 2.41, and the 200day EMA at 2.62. This configuration of descending moving averages signals a well-established downtrend with no confirmed reversal yet. Every rally towards these averages may encounter renewed supply as longer-term holders use strength to exit.
The daily RSI at 31.36 sits just above the oversold threshold. This level illustrates momentum exhaustion on the downside but not a confirmed reversal. It implies that sellers have pressed the market hard, yet there is still room for further weakness before conditions become extreme enough to force a sharp short-covering bounce.
Daily MACD remains negative, with the line at -0.13 versus a signal at -0.10 and a small negative histogram. This subtle configuration depicts waning but still bearish momentum: the impulse lower is losing intensity, though the bears remain in control. Traders watching for a sustainable shift would prefer to see the MACD line cross above the signal and the histogram flip decisively positive, neither of which has occurred yet.
Bollinger Bands on the daily chart show the midline around 2.24, the upper band at 2.53, and the lower band aligning almost exactly with the current price at 1.94. Trading on the lower band reflects a downside grind along the volatility boundary, typically associated with persistent selling rather than a single panic event. It indicates that the asset is cheap relative to its recent range, but not necessarily that a reversal is imminent.
The daily ATR of 0.16 suggests a moderate volatility regime. Price swings are meaningful but not extreme, hinting at controlled pressure rather than a disorderly collapse. In practice, this encourages structured strategies with clearly defined risk rather than expecting dramatic intraday spikes.
Intraday Perspective and XRP crypto Momentum
Meanwhile, intraday charts paint a more balanced short-term picture. On the hourly timeframe, the pair trades near 1.94, slightly above the 20hour EMA at 1.93 but below the 50hour and 200hour EMAs at 1.97 and 2.12.
This configuration reflects a tactical pause within a broader downtrend: short-term participants are no longer aggressively selling at market, yet they have not flipped the structure into a genuine uptrend.
Hourly RSI around 50.68 confirms this neutrality, indicating that intraday momentum has reset without favoring bulls or bears. MACD on this timeframe is almost flat, with the line and signal both near -0.01 and a negligible histogram, implying that short-term momentum is indecisive. As a result, the next impulse move is likely to be guided by reactions around nearby levels rather than by an entrenched intraday trend.
On the 15minute chart, the close matches the hourly level at 1.94, while the 20and 50period EMAs converge around 1.93 and the 200period EMA sits higher at 1.96. This tight clustering shows very short-term consolidation under a still-heavy higher-timeframe backdrop. The 15minute RSI at 59.11 tilts slightly bullish, and MACD edges marginally positive, hinting that scalpers are willing to probe the long side, albeit without strong confirmation from the larger trend.
Key Levels and Market Reactions for XRP
Daily pivot analysis highlights 1.93 as a central reference area, with an initial support region near 1.90 and the first resistance band around 1.97. Price currently hovers just above that central pivot, suggesting a delicate balance between dip-buyers and trend-following sellers.
A firm break beneath 1.90 would confirm that bears remain firmly in charge, potentially opening the way to a continuation of the downtrend.
Conversely, a sustained push above 1.97, followed by acceptance back toward the Bollinger midline near 2.24, would be the first meaningful sign that buyers are regaining some control. However, each step higher will likely meet supply near the descending EMAs at 2.22, 2.41, and 2.62, which structure a wide overhead zone where the primary bearish narrative could reassert itself.
Future Scenarios and Investment Outlook for XRP
Overall, the most probable scenario in the short to medium term is a bearish bias with intermittent relief rallies.
Daily trend and momentum remain negatively aligned, while intraday charts suggest that any bounce is more likely to be corrective than the start of a full-fledged reversal. In this environment, tactically minded traders may look to fade strength toward resistance zones, while longer-term participants might prefer to wait for clearer evidence of trend stabilization, such as a daily close back above the 20day EMA and a more constructive MACD profile.
Risk management remains crucial: volatility is moderate but persistent, and sentiment across the crypto market is still gripped by fear. Until the broader environment turns more constructive and key technical levels are reclaimed, exposure to this pair is best approached with patience, disciplined position sizing, and an awareness that the dominant trend still points downward.
This analysis is for informational purposes only and does not constitute financial advice.
Readers should conduct their own research before making investment decisions.
You May Also Like

JANCTION Forges Alliance with AltLayer to Enhance Blockchain Interoperability

XRP Technical Analysis Mar 21

