Hedera (HBAR) Rockets 10% in 24H, Could $0.40 Be Next?
- Hedera (HBAR) rises 10.4% in 24 hours despite weekly losses.
- The Support zone at $0.135–$0.14 shows strong buying interest.
- ISO 20022 adoption boosts crypto networks like HBAR and ICP.
- Price could test $0.18–$0.22 if support holds; $0.11 risk if broken.
Hedera (HBAR) is showing a solid upward move, with a notable 10.4% gain in the past 24 hours despite losing 7.61% over the week. This suggests a short-term bounce even as the broader market faces pressure.
At present, Hedera is trading at $0.1404 with a 24-hour volume of $188.82 million, down 34.68% over the same period. Its market cap stands at $924.67 million, reflecting a 10.59% increase.
Also Read: Hedera Hashgraph (HBAR) Eyes $0.19 Bounce as Key Support Holds
HBAR Key Support Levels and Possible Price Moves
HBAR is testing a key support zone around $0.135–$0.14, an area that has repeatedly attracted buyers. The recent dip to this level has triggered a rebound attempt. Historical trends show a previous rally of roughly 141.9% from this support, suggesting strong upside potential if buyers defend it successfully.
The charts show a likely double bottom being created around the level of support, marking a strong bullish reversal. A consolidation phase may cause it to break out to $0.18-$0.22. The level of resistance would be $0.38-$0.40; it’s here that resisting forces have created hindrances for the past prices to pass. A breakdown around support levels may cause it to move to $0.11.
Traders should look for confirmation of volumes and momentum. When the level of support holds, it may continue to $0.18-$0.22 and possibly beyond if buyers come in heavily. A bearish break below the level of support may target $0.11 and below if the general bearish trend reinitiates. The general areas of support and resistance will guide eventual trading of HBAR.
ISO 20022 Adoption Spurs Crypto Relevance
The full conversion by SWIFT to ISO 20022 over this weekend marks a major improvement in global banking. All payments between banks will be performed through standardized bank-to-bank payment messages following this new standard, improving efficiency, transparency, and interoperability in cross-border transactions.
The crypto networks, such as ICP and HBAR, have the advantage of this development. The ISO-compliant blockchain platforms, like ICP and HBAR, stand ready to be used as the banking systems adopt this new standard.
In particular, it can be seen that ICP stands out in technological advancements as it outperforms most other blockchain systems, given that crypto systems have yet to be aligned with the ISO 20022 standard.
Also Read: Hedera Q3 Report: HBAR Skyrockets 43% as Network Expansion Gains Momentum
You May Also Like
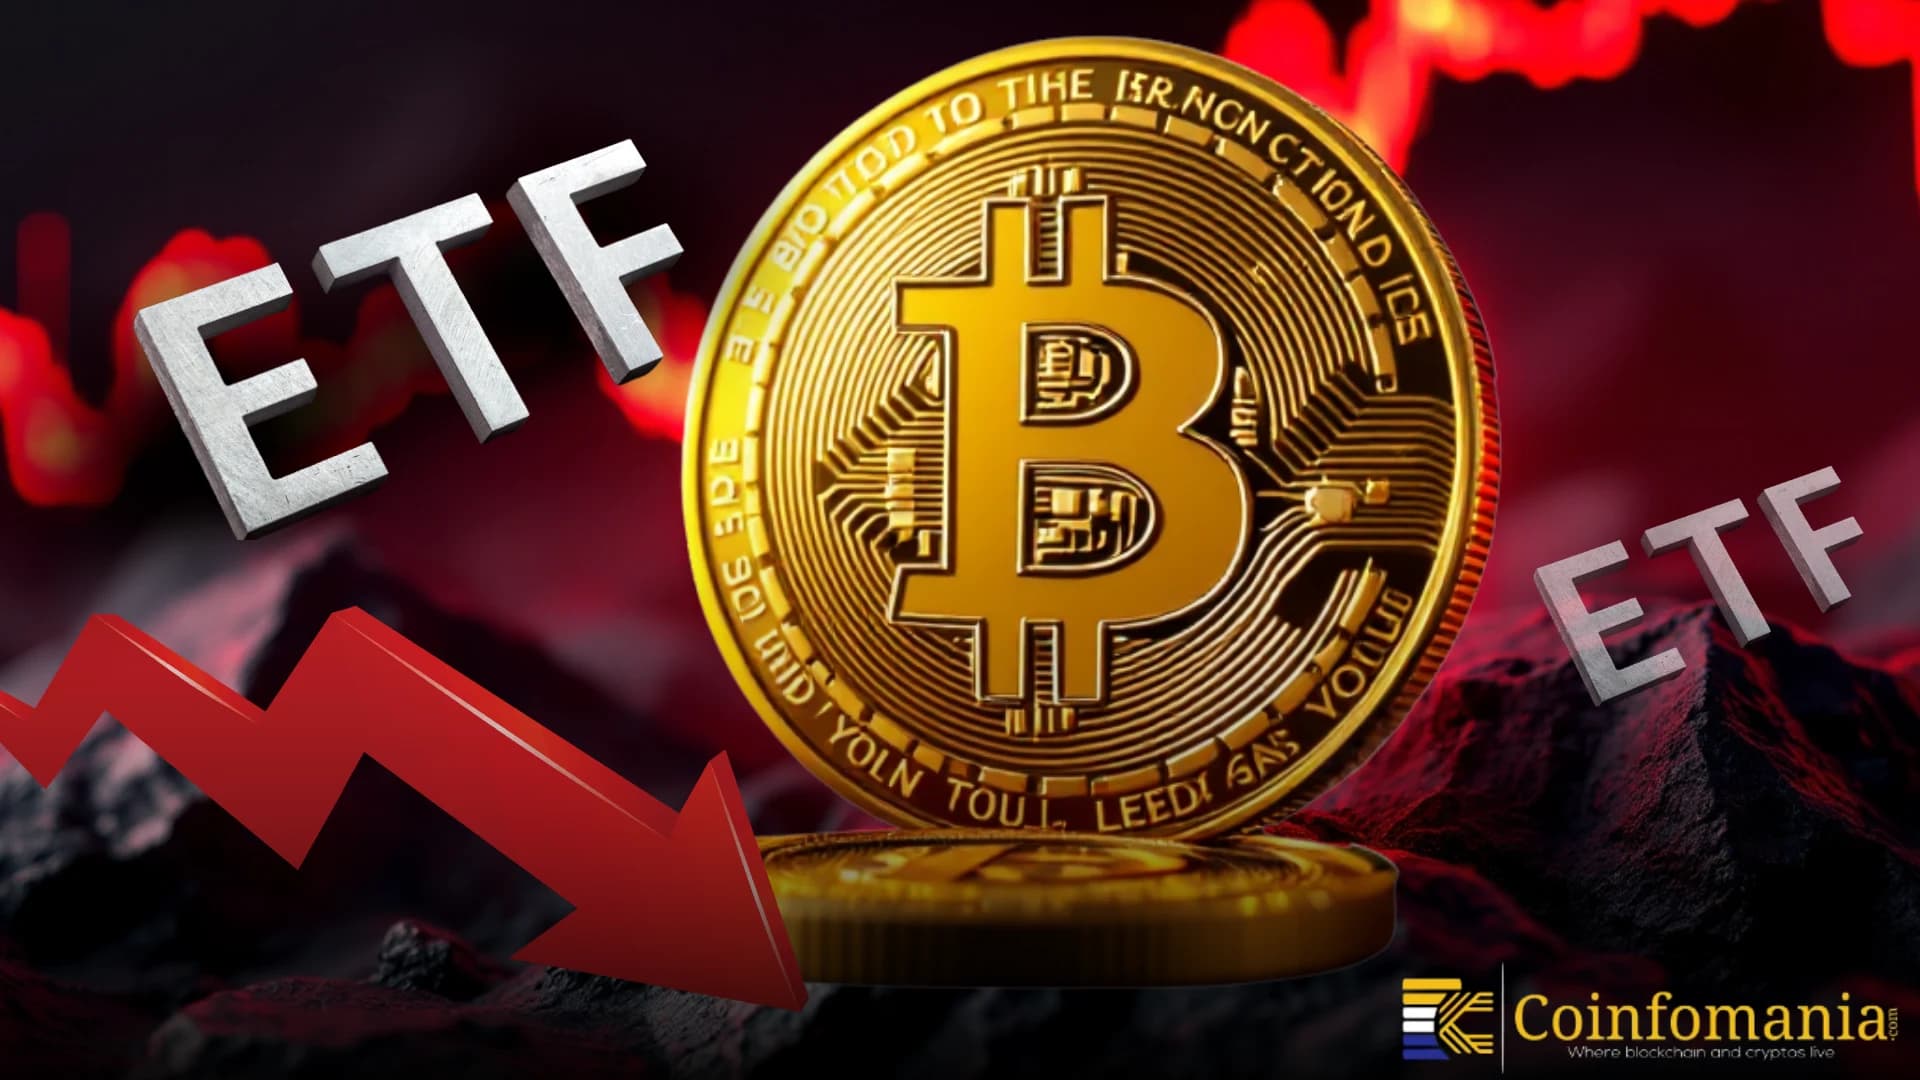
Spot Bitcoin ETFs Face Outflows Despite Strong March Inflows

Strategy CEO: If Morgan Stanley allocates 2% to Bitcoin, it will bring in approximately $160 billion in funds.