

NEAR Protocol price prediction 2026-2032: Is NEAR a good investment?
Key takeaways:
- NEAR price prediction indicates it may reach a maximum price of $3.08 by the end of 2026.
- By 2029, NEAR is expected to rise to a maximum price of $8.03, driven by increasing adoption and ecosystem growth.
- Looking ahead to 2032, NEAR Protocol could experience a substantial surge, potentially reaching a maximum price of $17.12 or beyond.
The rising bearish sentiment within NEAR Protocol’s community is bringing a cautious approach among traders. As NEAR continues to advance its technology and forge strategic partnerships, questions surrounding its current price potential persist, inviting further analysis and exploration of its prospects.
Overview
| Cryptocurrency | NEAR Protocol |
| Ticker | NEAR |
| Price | $1.74 (-1.2%) |
| Market Cap | $2.24 Billion |
| Trading Volume 24-h | $283 Million |
| Circulating Supply | 1.28 Billion NEAR |
| All-time High | $20.42 Jan 17, 2022 |
| All-time Low | $0.526, Nov 04, 2020 |
| 24-h High | $1.84 |
| 24-h Low | $1.73 |
NEAR Protocol price prediction: Technical analysis
| Sentiment | Neutral |
| 50-Day SMA | $1.73 |
| 200-Day SMA | $2.34 |
| Price Prediction | $2.94 (66.14%) |
| F & G Index | 22.41 (extreme fear) |
| Green Days | 16/30 (54%) |
| 14-Day RSI | 71.12 |
NEAR Protocol price analysis: NEAR climbs to $1.81
TL;DR Breakdown:
- NEAR Protocol price analysis confirms a downward trend, decreasing to $1.74
- Cryptocurrency loses 1.2% of its value.
- NEAR Protocol coin has support around $1.50.
On January 6, 2026, NEAR Protocol price analysis reveals a strong bullish trend as the price action observes sharp rise across the last ten days. The altcoin’s current value decreased to $1.74 in the past 24 hours. Overall, the currency has lost 1.2% in value, as the bearish pressure continues to weigh heavily on the asset.
NEAR Protocol price analysis 1-day chart: NEAR falls rapidly towards $1.74
The one-day price chart of NEAR Protocol confirms a downward trend for the day. The NEAR/USD price found support at the $1.50 mark and initiated a quick recovery to $1.81 before facing strong resistance that caused the price to decline back below $1.75.
 NEAR/USDT price chart: TradingView
The Relative Strength Index (RSI) indicator is trending high in the neutral area. The indicator’s value has also decreased to index 54.11. This shows rising selling momentum, as the indicator’s curve is pointing downwards to the lower half of the neutral area. A further downtrend in the market can be expected if selling momentum continues to intensify.
NEAR price analysis 4-hour chart
The four-hour chart analysis of NEAR shows a bearish trend. The coin’s value has declined rapidly across the last few hours. The recent downshift is suppressing the price once again suggesting a price breakdown below the $1.70 mark as the bears continue to pressure the short-term markets.
 NEAR/USDT price chart: TradingView
The Bollinger Bands are widening suggesting increasing volatility with the bands suggesting a support at $1.815 and resistance at $1.675.
The RSI indicator is present in the neutral region for now. The indicator’s value has risen to 54.11, indicating decreasing selling pressure and room for further downwards movement across the short-term.
NEAR Protocol technical indicators: Levels and actions
Daily simple moving average (SMA)
| Period | Value | Action |
|---|---|---|
| SMA 3 | $ 1.87 | SELL |
| SMA 5 | $ 1.75 | SELL |
| SMA 10 | $ 1.66 | SELL |
| SMA 21 | $ 1.65 | SELL |
| SMA 50 | $ 1.88 | SELL |
| SMA 100 | $ 2.21 | SELL |
| SMA 200 | $ 2.48 | SELL |
Daily exponential moving average (EMA)
| Period | Value | Action |
|---|---|---|
| EMA 3 | $ 1.66 | SELL |
| EMA 5 | $ 1.81 | SELL |
| EMA 10 | $ 2.04 | SELL |
| EMA 21 | $ 2.27 | SELL |
| EMA 50 | $ 2.44 | SELL |
| EMA 100 | $ 2.53 | SELL |
| EMA 200 | $ 2.83 | SELL |
What to expect from NEAR Protocol price analysis?
 NEAR/USDT price chart: TradingView
Near Protocol price analysis gives a negative prediction. The NEAR/USD price has decreased to $1.74 in the past 24 hours. If sellers hold the ongoing momentum, we might see the price fall below $1.70 once again.
Is Near Protocol a good investment?
The near token distinguishes itself in the cryptocurrency market capitalization, emphasizing scalability, usability, and developer-friendliness. It aims to facilitate the creation of decentralized applications (dApps) and smart contracts, catering to developers and end-users. NEAR’s innovative technology and user-centric approach make it attractive for institutional adoption and mainstream adoption of blockchain applications.
With a focus on user experience and developer tools, NEAR Protocol is positioned to drive significant medium term growth in the decentralized application ecosystem. Its potential to disrupt traditional industries and capture market share in the blockchain space makes it an intriguing investment opportunity for those interested in innovative technology solutions.
Why is NEAR down?
NEAR is trading at $1.74 as after reaching the $1.81 mark, the price faced strong bearish pressure and crumbled back below $1.75.
Will NEAR recover?
NEAR protocol price has seen a massive selloff in the last thirty days as price fell from near the $3.00 mark to the current $1.7 price level. However, analysts believe that this bearish momentum will be short-term, predicting price targets in a range of $2.5 and the $2.8 mark by the end of 2026.
Will NEAR reach $10?
NEAR is expected to rise to the $10.00 mark by the end of 2030 supported by the bullish trends surrounding the broader cryptocurrency markets.
Will NEAR reach $20?
NEAR protocol price is expected to cross the $20 threshold by mid-2030s This supports the long term forecast as the industry continues to see increasing adoption across the mainstream. The bullish rally will be supported by NEAR’s vision of a scalable future and user and developer-friendly architecture that sets it apart from other blockchains.
Will NEAR reach $50?
The chance of NEAR protocol price reaching the $50 mark depends on various circumstances, such as future network development, market regulations, and the broader cryptocurrency market growth. If NEAR continues its current trajectory, it can reach $50 in the next several years.
Does NEAR have a good long term future?
Yes, NEAR has a good long-term future due to its innovative technology, focus on scalability and strong ecosystem development, which supports a favorable market sentiment and price prediction. However, the project must keep up with sector developments to maintain its edge in the digital ecosystem.
Recent news/opinions on Near Protocol
NEAR protocol recently celebrated 9 billion volume on Near Intents.
NEAR price prediction January 2026
NEAR protocol price forecast for the month of January is expected to trade at a minimum price of $1.66 based on the latest price data, with an average trading price of $1.76 and a maximum price of $2.26.
| Month | Minimum Price ($) | Average Price ($) | Maximum Price ($) |
| January | 1.66 | 1.76 | 2.26 |
NEAR price prediction 2026
In 2026, technical analysis anticipates a continued rise with a minimum price of $1.66, an average of $2.70, and a maximum of $3.08.
| Year | Minimum Price ($) | Average Price ($) | Maximum Price ($) |
| 2026 | 1.66 | 2.70 | 3.08 |
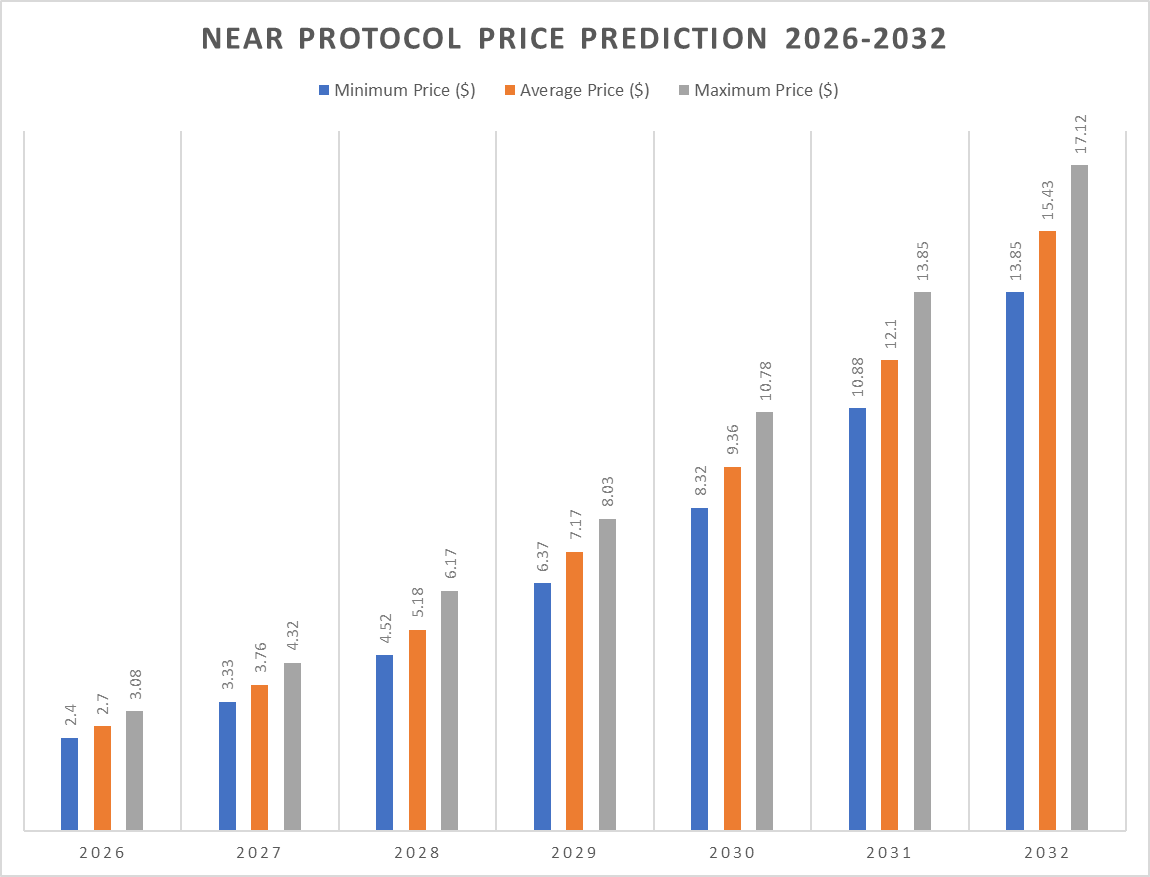
NEAR price prediction 2026-2032
| Year | Minimum Price ($) | Average Price ($) | Maximum Price ($) |
| 2027 | 3.33 | 3.76 | 4.32 |
| 2028 | 4.52 | 5.18 | 6.17 |
| 2029 | 6.37 | 7.17 | 8.03 |
| 2030 | 8.32 | 9.36 | 10.78 |
| 2031 | 10.88 | 12.10 | 13.85 |
| 2032 | 13.85 | 15.43 | 17.12 |
NEAR Price Prediction 2027
In 2027, technical analysis anticipates a continued rise with a minimum price of $3.33, an average of $3.76, and a maximum of $4.32.
NEAR Price Prediction 2028
For 2028, NEAR Protocol may trade around a minimum of $4.52, an average of $5.18, and a maximum value of $6.17 by year-end.
NEAR Protocol Prediction 2029
The 2029 outlook remains bullish with estimates suggesting a minimum value of $6.37, an average trading value of $7.17, and a maximum of $8.03.
NEAR Price Prediction 2030
By 2030, NEAR could potentially trade at a minimum of $8.32, an average of $9.36, and a maximum value of $10.78.
NEAR Price Prediction 2031
Forecasts for 2031 reflect long-term upward sentiment with a minimum of $10.88, an average price of $12.10, and a maximum of $13.85.
NEAR Price Prediction 2032
The forecast for 2032 suggests NEAR could see a minimum value of $13.85, an average price of $15.43, and a maximum value of $17.12 based on current projections.
NEAR Price Prediction 2026-2032
NEAR market price prediction: Analysts’ NEAR price forecast
| Firm | 2026 | 2027 |
| Coincodex | $6.40 | $7.47 |
| DigitalCoinPrice | $2.56 | $4.61 |
Cryptopolitan’s NEAR protocol (NEAR) price prediction
Cryptopolitan’s predictions show that the price of the NEAR Protocol will reach a high of $3.08 in the second half of 2026. In 2029, it is expected to range between $6.37 and $8.03. In 2032, NEAR may trade between $13.85 and $17.12, with an average value of $15.43 according to protocol technical analysis. Note that these predictions are not investment advice regarding future price movements. Seek independent professional consultation or do your research.
NEAR Protocol historic price sentiment
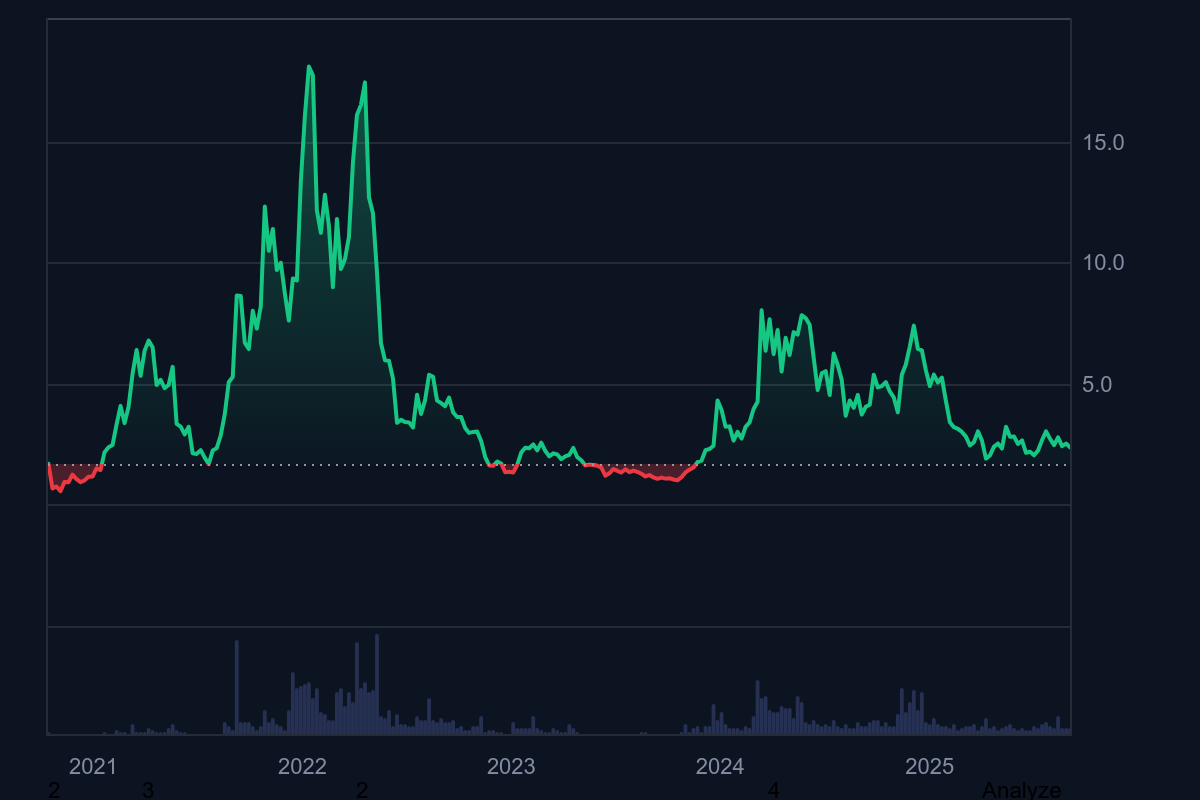
NEAR price history
- The Near Protocol (NEAR) began its journey in August 2020, aiming to create a scalable and permissionless blockchain. The first recorded trade value in October 2020 was $1.072, closing the year at $1.459 after a recovery.
- In 2021, NEAR showed an uptrend, starting at $1.305 and reaching an all-time high (ATH) of $7.572 by March 13. A market downturn pushed the price down to $1.537 by July 19, but it rebounded to $11.776 on September 9 and further to $13.168 on October 26.
- By 2022, NEAR’s price crashed to below $2.00, losing over 90% of its peak value. Throughout 2023, NEAR saw low volatility, with prices remaining below $2.50 for most of the year.
- Since the start of 2024, NEAR has experienced a strong recovery, climbing to $7.80. However, after reaching the $8.00 mark in mid-May, it fell back to $5.60. In June, NEAR traded between $4.48 and $7.66. It rose from $5.20 to $6.04 in July but closed the month below $5.00. NEAR started August at $5.00, declining to $3.89 by the end of the month.
- In September 2024, the asset bounced back and closed the month above the $5.20 mark. In October, the price stumbled and fell to $4.850 in the first few days before closing the month below the $4.00 mark leaving a negative outlook at the start of November.
- November saw NEAR making remarkable strides as the bulls held strong control of markets during the month, a trend that was expected to continue into December. However, the month saw NEAR plummet from heights of $7.00 to fall below $5 before closing the month.
- In January the price could not find a stable foothold and the price continued dwindling, closing the month just above $4.00
- In February the price fell significantly towards the $3.00 mark and continued to decline ending the month at $2.80. In March the price continued to decline ending the month near $2.50, a trend that continued in April ending the month at $2.35. In May the price recovered but only to the extent of reversing April’s losses as the month ended below $2.50.
- June saw further decay as despite the early bullish signals, bears dominated the month and NEAR closed the month around $2.12.
- In mid-July, the price of NEAR Protocol surged toward the high of $3 but it started to decay in the later half of the month, a trend that continued in August with NEAR closing the month at $2.38. In September, the price rose sharply to the $3.40 mark but failed to maintain the level ending the month at $3.00
- In October the price declined further as bears dominated the crypto markets with NEAR ending the month below the $2.00 mark. The trend continued in November with NEAR closing the month at the $1.80 mark.


You May Also Like

PMI-ACP Exam Preparation: How to Use a Simulator and Practice Questions Effectively

What a $900 Investment in New Crypto Protocols Could Become by Late 2027


