XRP Price Outlook: XRP Drops 2% Despite Steady ETF Inflows
Highlights:
- XRP price has declined 2% to $2.16, as the crypto market struggles to sustain recovery.
- The XRP ETFs record steady inflows, despite the sentiment lagging.
- The technical outlook indicates mixed signals as bearish momentum mounts, targeting $2.00 support zone.
The Ripple (XRP) price is down 2% currently trading at $2.16, as the daily trading volume has plummeted 37%. The cross-border payment token dropped to the lowest point of $2.30 on Monday, which indicates a grip of bearishness in the larger cryptocurrency market. This is despite the price rising following the launch of XRP Exchange-traded Funds (ETFs).
Since they were first launched in mid-November, interest in XRP ETFs listed on US stock exchanges has been getting better. Four XRP ETFs are already running in the US, with Canary Capital operating the XRPC ETF. Bitwise operates the XRP ETF, Grayscale operates a GXRP ETF, and Franklin Templeton operates XRPZ. The XRP ETFs have had around $35 million in inflows on Tuesday, which increased the total volume up to $622 million and net assets up to 645 million.
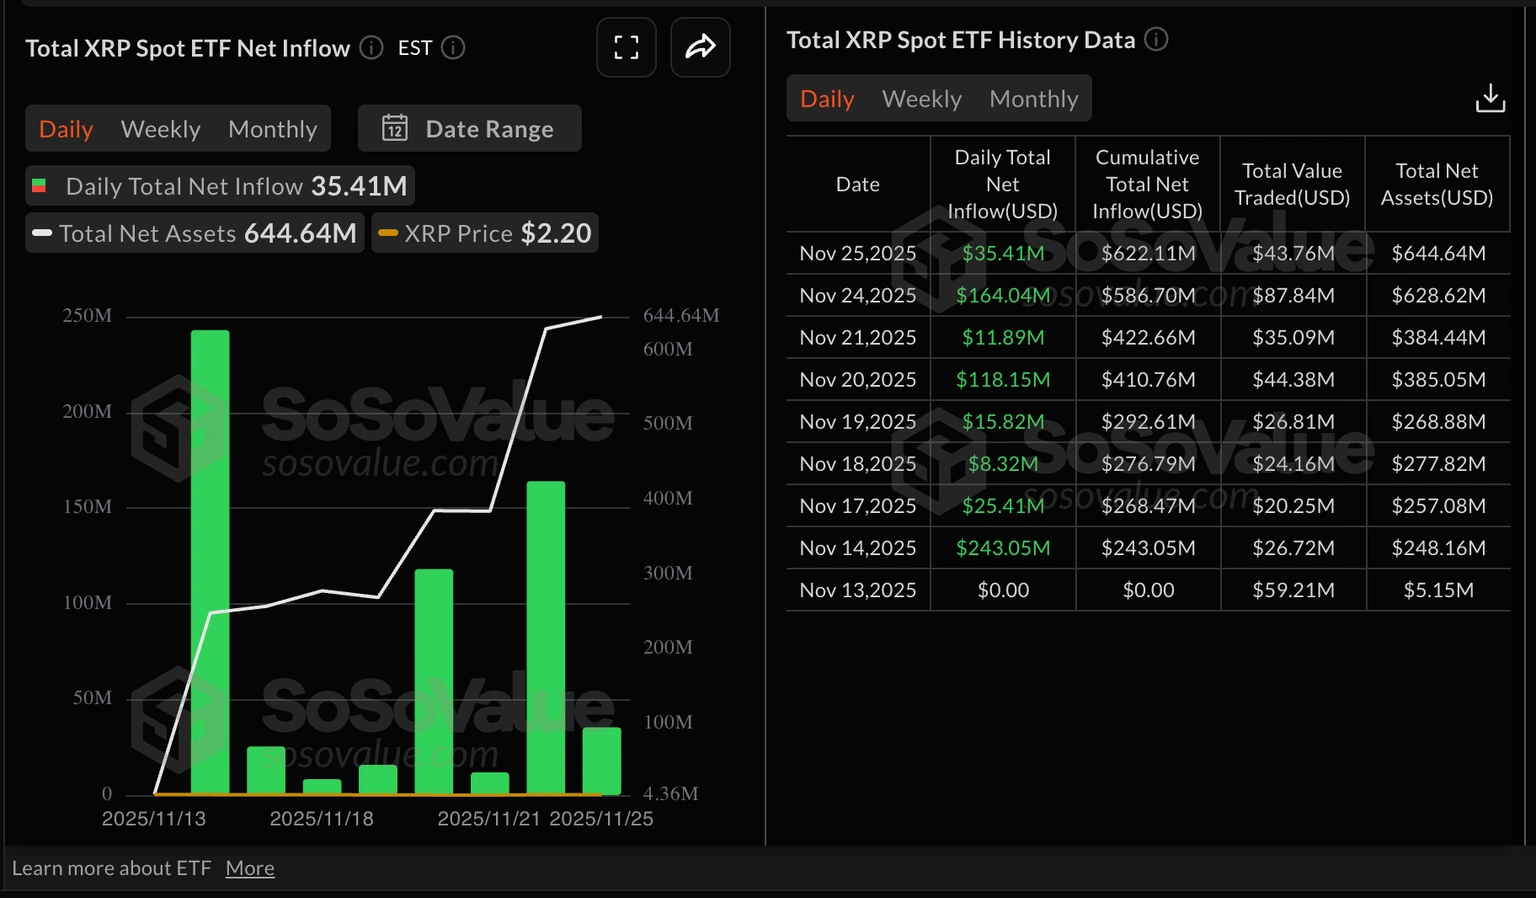 Total XRP Spot ETF Net Inflow: SoSoValue
Meanwhile, the ETF flows are used to measure the sentiments of the market, with inflows supporting a bullish market and outflows reflecting a bearish market view.
On the other hand, the retail level in XRP has not been very high, and futures Open Interest (OI) has not been able to stabilize above $4 billion since November 11. The CoinGlass data shows that OI, measuring the notional value of outstanding futures contracts, had an average of $3.96 billion on Wednesday compared to $4 billion the previous day.
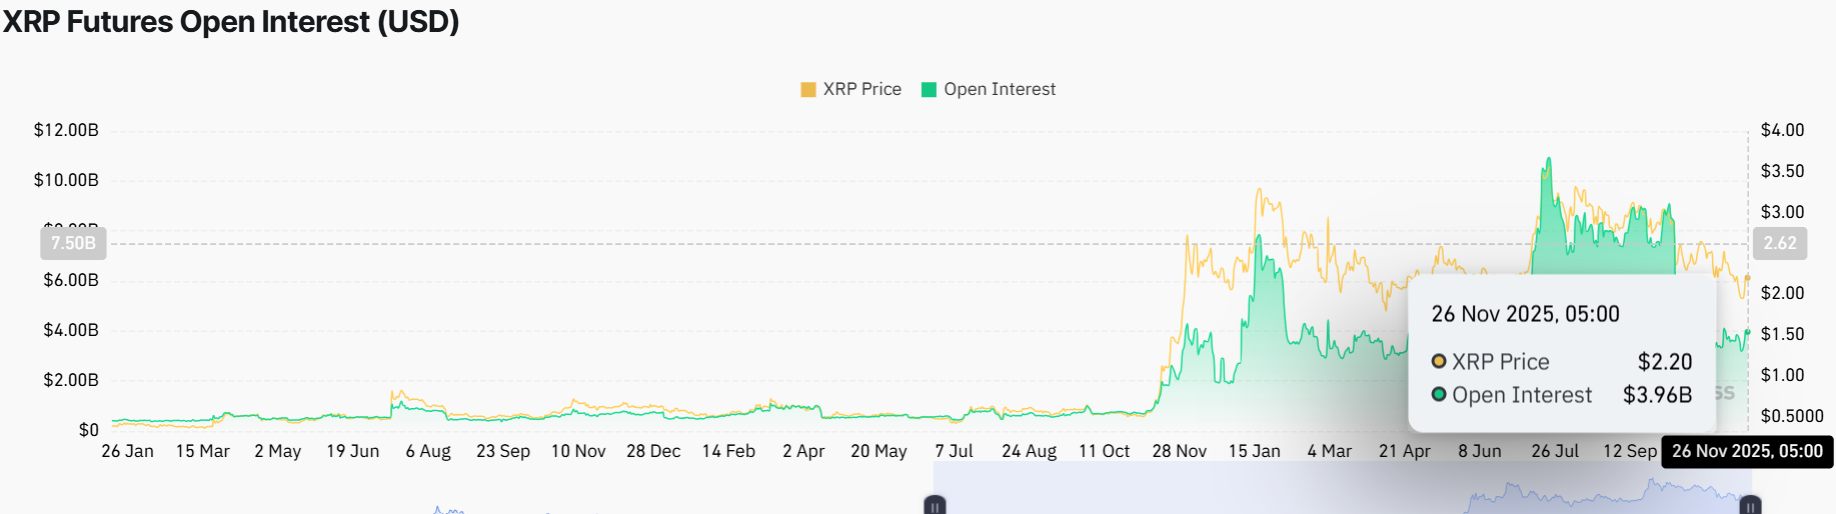 XRP Futures Open Interest: CoinGlass
The lack of an increase in the OI has been accompanied by the price falling to $1.82 on Friday. When the store’s demand is under pressure, it will be hard to maintain the recovery.
XRP Price Shows Mixed Signals
The XRP price is trading at $2.16, staying below the important 50-day moving average (SMA) at $2.36, which acts as immediate resistance. The 200-day SMA near $2.62 is the next major barrier for long-term buyers. The XRP price remains inside a falling channel, with the bears having the upper hand. The Relative Strength Index (RSI) hovers around 45.47, indicating neutral momentum, neither overbought nor oversold.
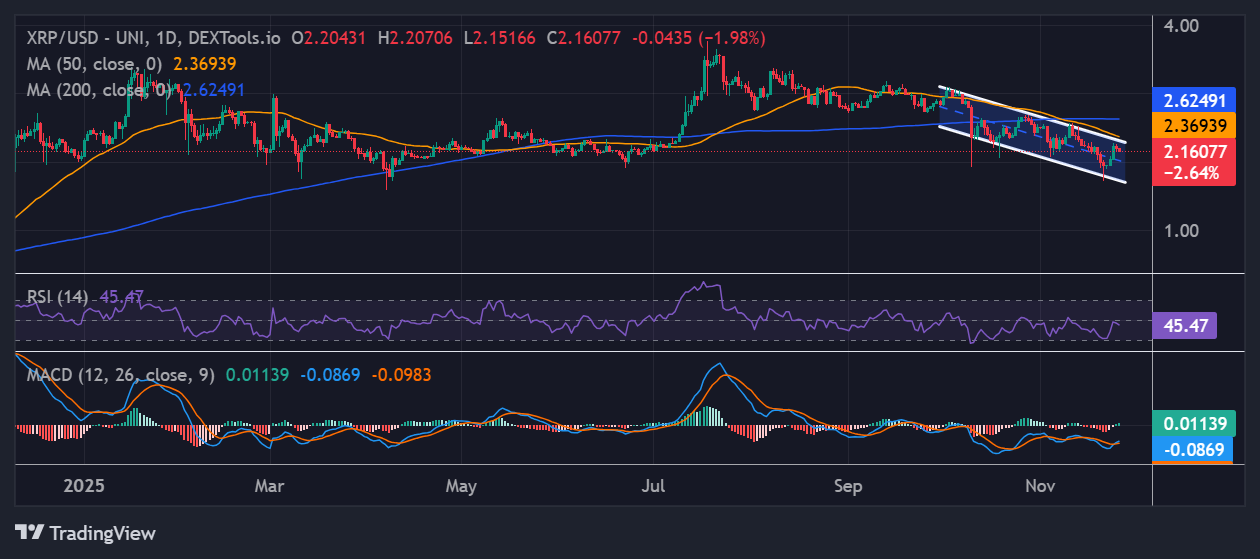 XRP/USD 1-day chart: TradingView
The MACD indicator shows the MACD line above the signal line with positive histogram bars. This suggests short-term bullish momentum may continue if the bulls strengthen the buying pressure. Looking ahead, if buyers defend the $2.00 support, a rebound to test resistance at $2.39 is possible.
A push above this resistance could open the door to $2.62 and then $3.00, if the bullish sentiment bolsters. Moreover, the buy signal from the MACD indicator also reinforces a short-term rebound. On the other hand, if sellers take control and the XRP price loses support at $2.00, the price could drop quickly to $1.93 or even $1.80, where the next major buying zones sit. In the meantime, the traders are sidelined, as they wait and see the next direction in the XRP market.
eToro Platform
Best Crypto Exchange
- Over 90 top cryptos to trade
- Regulated by top-tier entities
- User-friendly trading app
- 30+ million users
eToro is a multi-asset investment platform. The value of your investments may go up or down. Your capital is at risk. Don’t invest unless you’re prepared to lose all the money you invest. This is a high-risk investment, and you should not expect to be protected if something goes wrong.
You May Also Like

What happened in crypto today: Hormuz tensions, oil prices impact the market

Tokyo’s Metaplanet Launches Miami Subsidiary to Amplify Bitcoin Income