

SEI crypto price struggles near lows as sellers keep control
 The SEI crypto price is trading in a clearly pressured environment, with the pair hovering around 0.13 USDT as broader risk assets retreat. However, the setup is nuanced: while sellers dominate the trend, oversold conditions and compressed volatility suggest that the next few sessions could bring either a relief bounce or a fresh leg down, depending on how traders react around nearby support.
 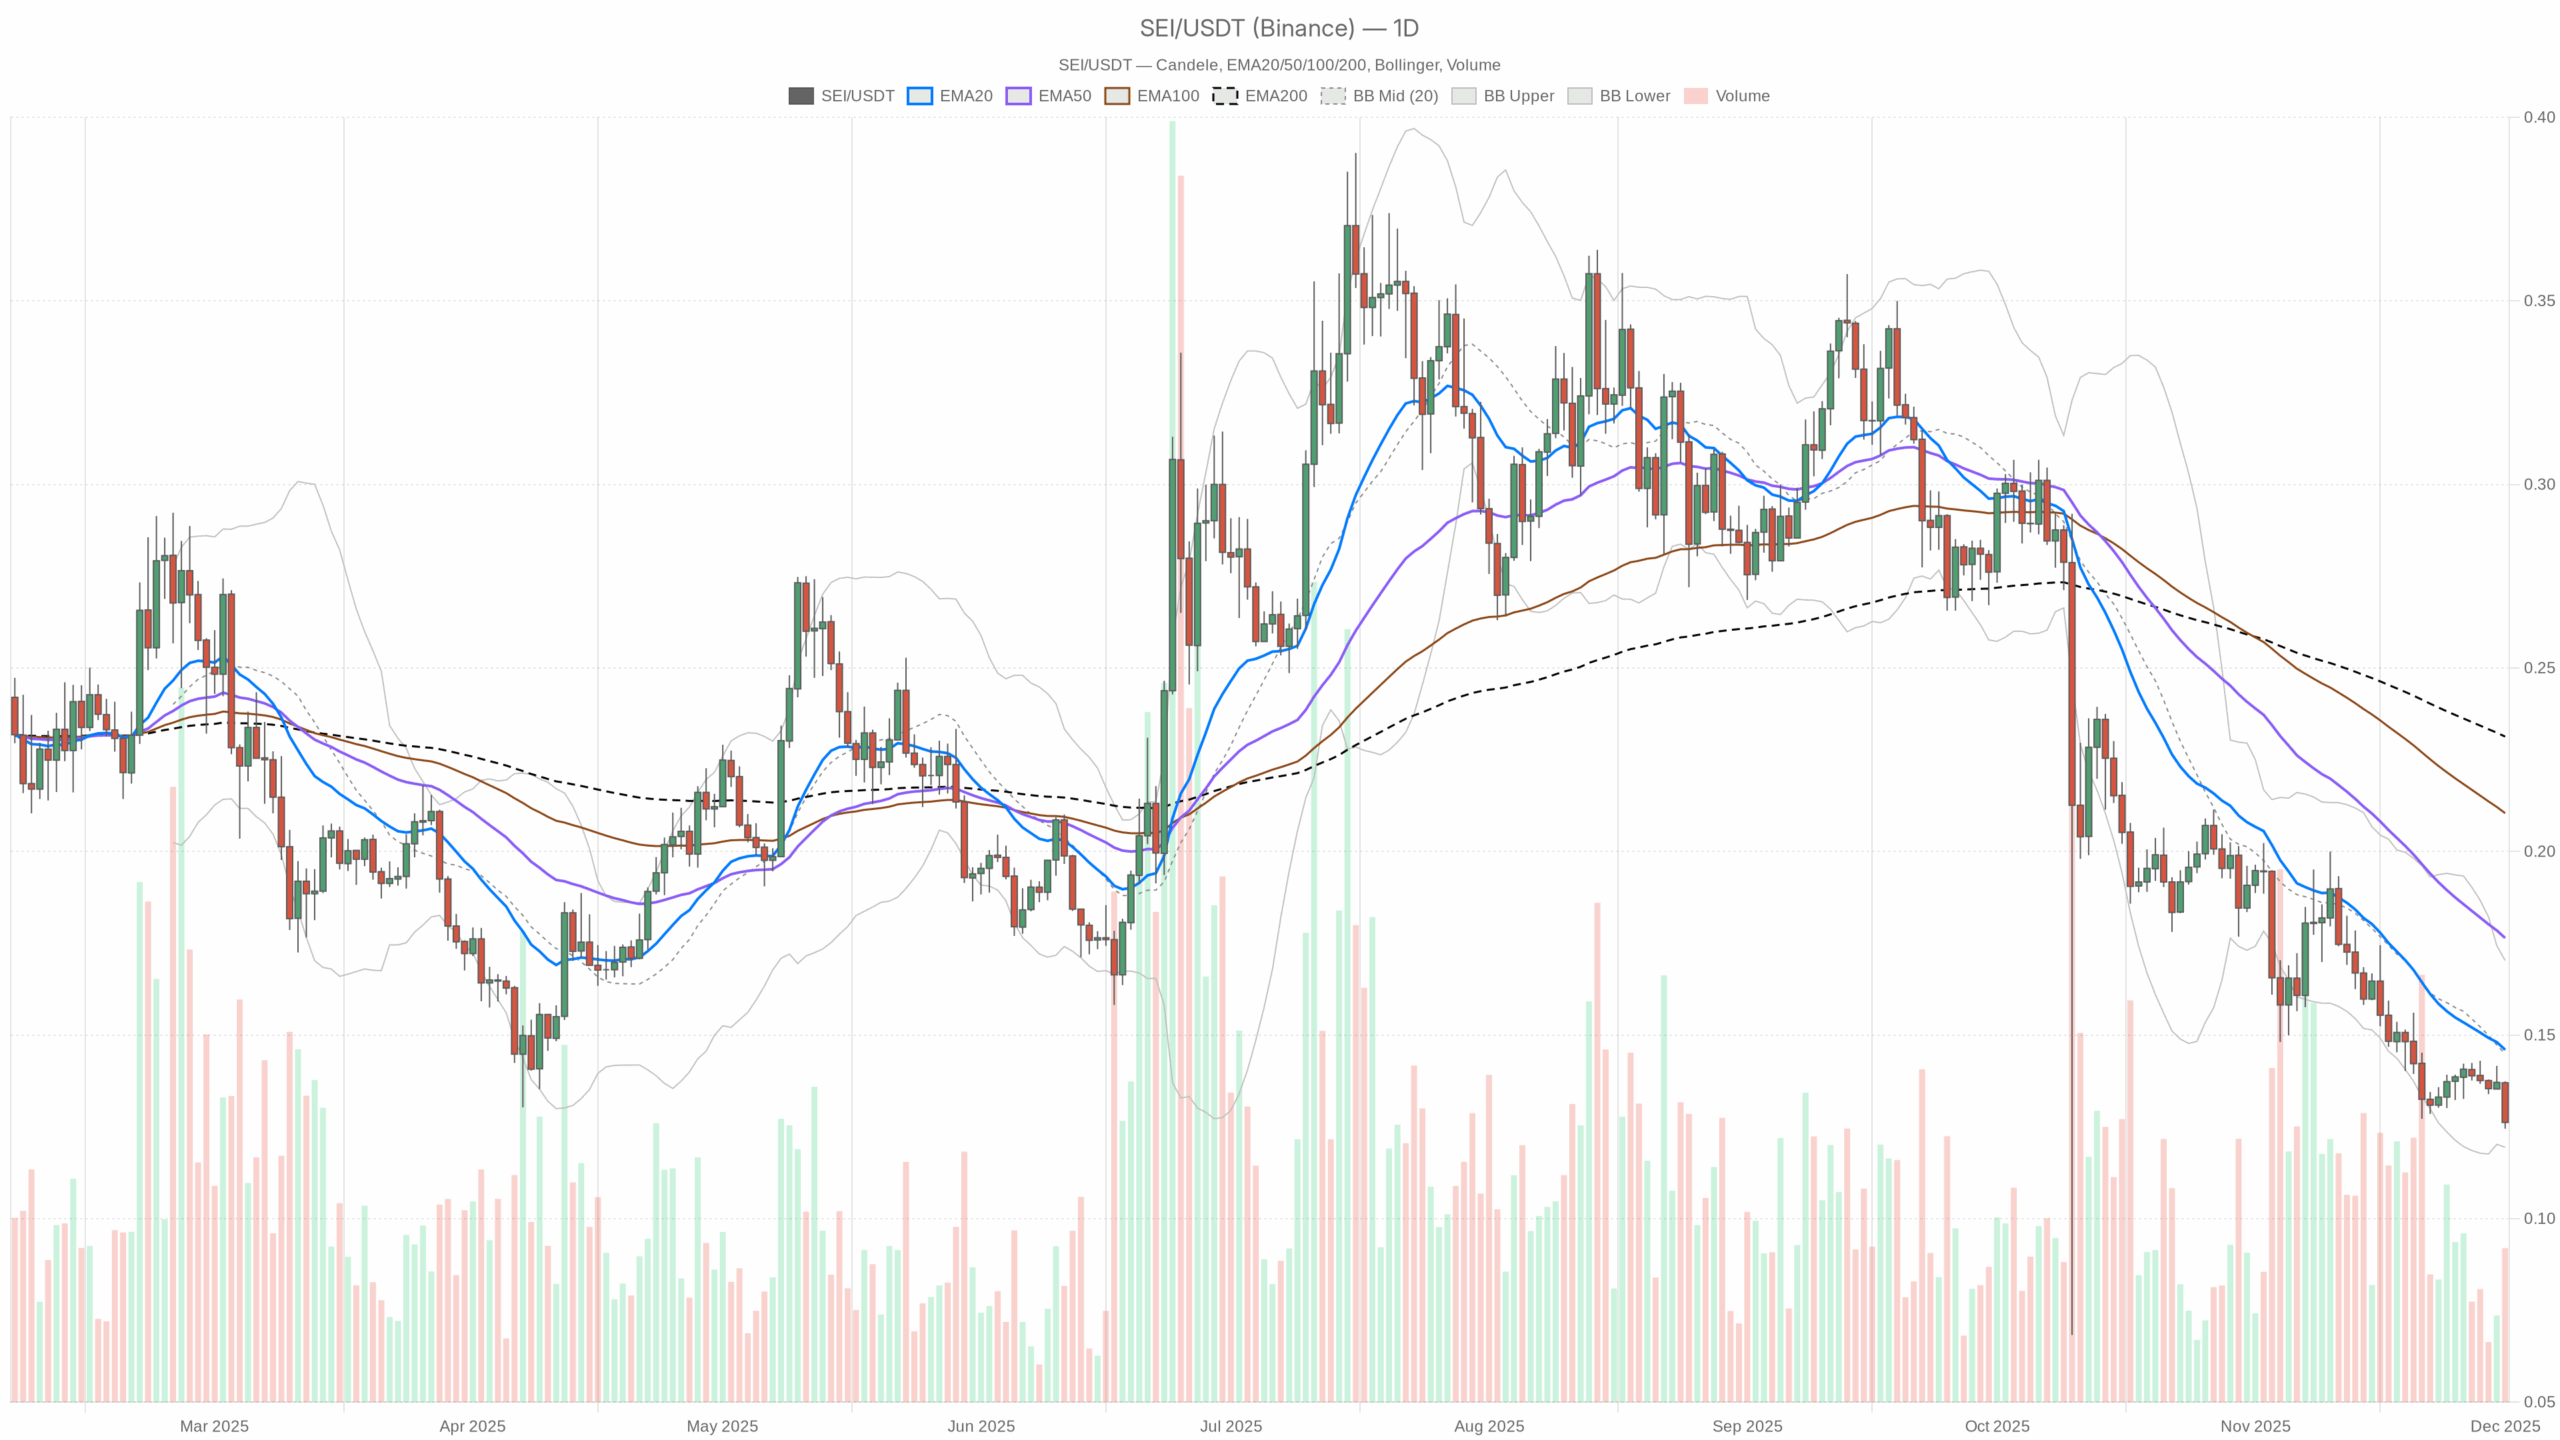 SEI/USDT — daily chart with candlesticks, EMA20/EMA50 and volume.
Summary
The daily chart shows a firmly bearish market regime, with price sitting below the 20, 50 and 200-day exponential moving averages. Momentum is weak, and the daily RSI is in oversold territory, signaling persistent selling pressure but also the risk of a short-covering rebound. Moreover, Bollinger Bands are relatively tight, pointing to low realized volatility after the recent slide. Pivot levels cluster close to spot, underlining an area where short-term positioning is likely to be finely balanced. Meanwhile, the broader crypto market is under stress, with total capitalization down nearly 5% over 24 hours and sentiment stuck in Extreme Fear. Overall, buyers are on the defensive, but the risk-reward dynamic is slowly shifting for more contrarian participants.
SEI crypto price: Market Context and Direction
The broader backdrop does not support aggressive risk-taking. Total crypto market capitalization stands near 3.03 trillion dollars, yet it has fallen about 4.9% in the last 24 hours, highlighting a synchronized risk-off move. Moreover, Bitcoin dominance sits around 57%, illustrating how capital is crowding into the perceived safest large-cap rather than into smaller tokens such as this one.
The sentiment picture reinforces this caution. The Fear & Greed Index prints at 24, firmly in the Extreme Fear zone, which often coincides with forced deleveraging and reduced liquidity in altcoins. In such phases, even small sell orders can push prices lower, and rebounds tend to be sold quickly. That said, extreme readings can also precede medium-term turning points, as panic eventually exhausts itself.
Within this macro framework, the asset is trading in line with the broader market stress, not against it. As long as Bitcoin retains such a strong share of market capitalization and overall sentiment remains depressed, a sustained bullish reversal for this pair will likely need a broader shift in the crypto risk appetite, not just idiosyncratic strength.
Technical Outlook: reading the overall setup
On the daily timeframe, price closes near 0.13 USDT, solidly below the 20-day EMA at 0.15, the 50-day at 0.18 and the 200-day at 0.23. This stacked configuration indicates trend confirmation to the downside, with every medium-term reference level positioned above current price and potentially acting as overhead supply. For swing traders, this alignment argues against calling a trend reversal too early.
The RSI at 29.84 has slipped into oversold territory. This level of weakness signals that bears have been in control for some time; however, it also hints at momentum exhaustion. When RSI spends time below 30, follow-through to the downside often becomes harder unless new negative catalysts emerge.
The daily MACD line and signal are both around -0.01, with the histogram flat at 0. The lack of a strong spread between the two lines underlines a phase of trend deceleration after the prior drop. It does not yet show a convincing bullish crossover, but it suggests that the strongest portion of the selling wave might be behind us, at least temporarily.
Bollinger Bands on the daily chart are centered around 0.14, with the upper band at 0.17 and the lower at 0.12. Price is sitting closer to the lower band but not aggressively piercing it, a sign of a controlled, grinding decline rather than a full capitulation. This configuration points to modest volatility expansion risk: any strong reaction, bullish or bearish, could quickly ride the bands once traders step back in with size.
The ATR over 14 days is near 0.01, confirming that realized volatility remains contained despite the downtrend. As a result, risk sizing for new positions can be more tightly calibrated, but traders should stay alert: a breakout from such low-ATR conditions often leads to sharper directional swings.
Intraday Perspective and SEIUSDT token Momentum
On the hourly chart, the picture stays aligned with the daily downtrend. The price hovers around 0.13, near the 20 and 50-period EMAs, while the 200-period EMA sits slightly higher at 0.14. This suggests a short-term consolidation taking place within a broader bearish structure. Meanwhile, the hourly RSI around 27 continues to flag oversold conditions, mirroring the daily signal.
The MACD on the H1 and M15 charts is essentially flat, with both line and signal at 0 and no visible histogram expansion. As a result, intraday traders lack a clear momentum cue and may hesitate to commit strongly in either direction. The 15-minute chart, with price glued to its EMAs and Bollinger Bands compressed around 0.13, depicts a market waiting for a catalyst.
This short-term stasis, combined with oversold readings, opens the door to quick intraday mean-reversion bounces. However, as long as higher timeframes remain firmly negative, such moves are likely to be treated as opportunities to reduce exposure rather than the start of a lasting uptrend.
Key Levels and Market Reactions
On the daily pivot map, the central point sits at 0.13, essentially where the pair is trading. The first support area emerges near 0.12, close to the lower Bollinger Band, forming a confluence where dip buyers may attempt to defend the trend. If price starts closing decisively below the 0.12 region, it would confirm that bears have regained momentum after a brief pause.
On the upside, the immediate resistance cluster appears between the pivot at 0.13 and the 20-day EMA at 0.15. A rebound towards that band would still leave the broader trend intact but could signal the beginning of a more extended consolidation phase. Only a sustained reclaim of the 0.15–0.18 zone, where short and medium EMAs converge, would seriously question the prevailing downtrend and hint at a potential market regime shift.
Future Scenarios and Investment Outlook
Overall, the balance of evidence favors a continuation of the bearish bias, with oversold indicators arguing more for sideways digestion than for an immediate bullish reversal. In the near term, a test of the 0.12 area looks plausible, especially if broader market sentiment stays anchored in Extreme Fear and Bitcoin dominance remains elevated. Short-term traders might focus on tactical bounces from oversold zones, but should respect the dominance of sellers on the higher timeframes.
For more patient participants, waiting for a clearer signal of trend reversal could prove prudent. That would likely require a combination of improved market sentiment, a recovery above key EMAs, and confirmation from RSI and MACD that downside momentum has truly faded. Until then, this asset remains a market where capital preservation and careful sizing take precedence over aggressive dip buying, even if occasional rallies from compressed conditions can be sharp and tempting.
This analysis is for informational purposes only and does not constitute financial advice.
Readers should conduct their own research before making investment decisions.


You May Also Like

Top 3 Cryptos to Buy Now for 100x as SOL and XRP Rally While Pepeto Nears Binance Listing

Iran agrees to hand over enriched uranium stockpile ahead of Islamabad talks


