

XRP Price Today: Weakness Phase and Crucial Technical Levels
 The price of XRP today is moving in a context of clear bearish pressure, with the token trading slightly below key moving averages. Additionally, technical indicators outline a still fragile picture, but with some signs of possible stabilization in the short term.
 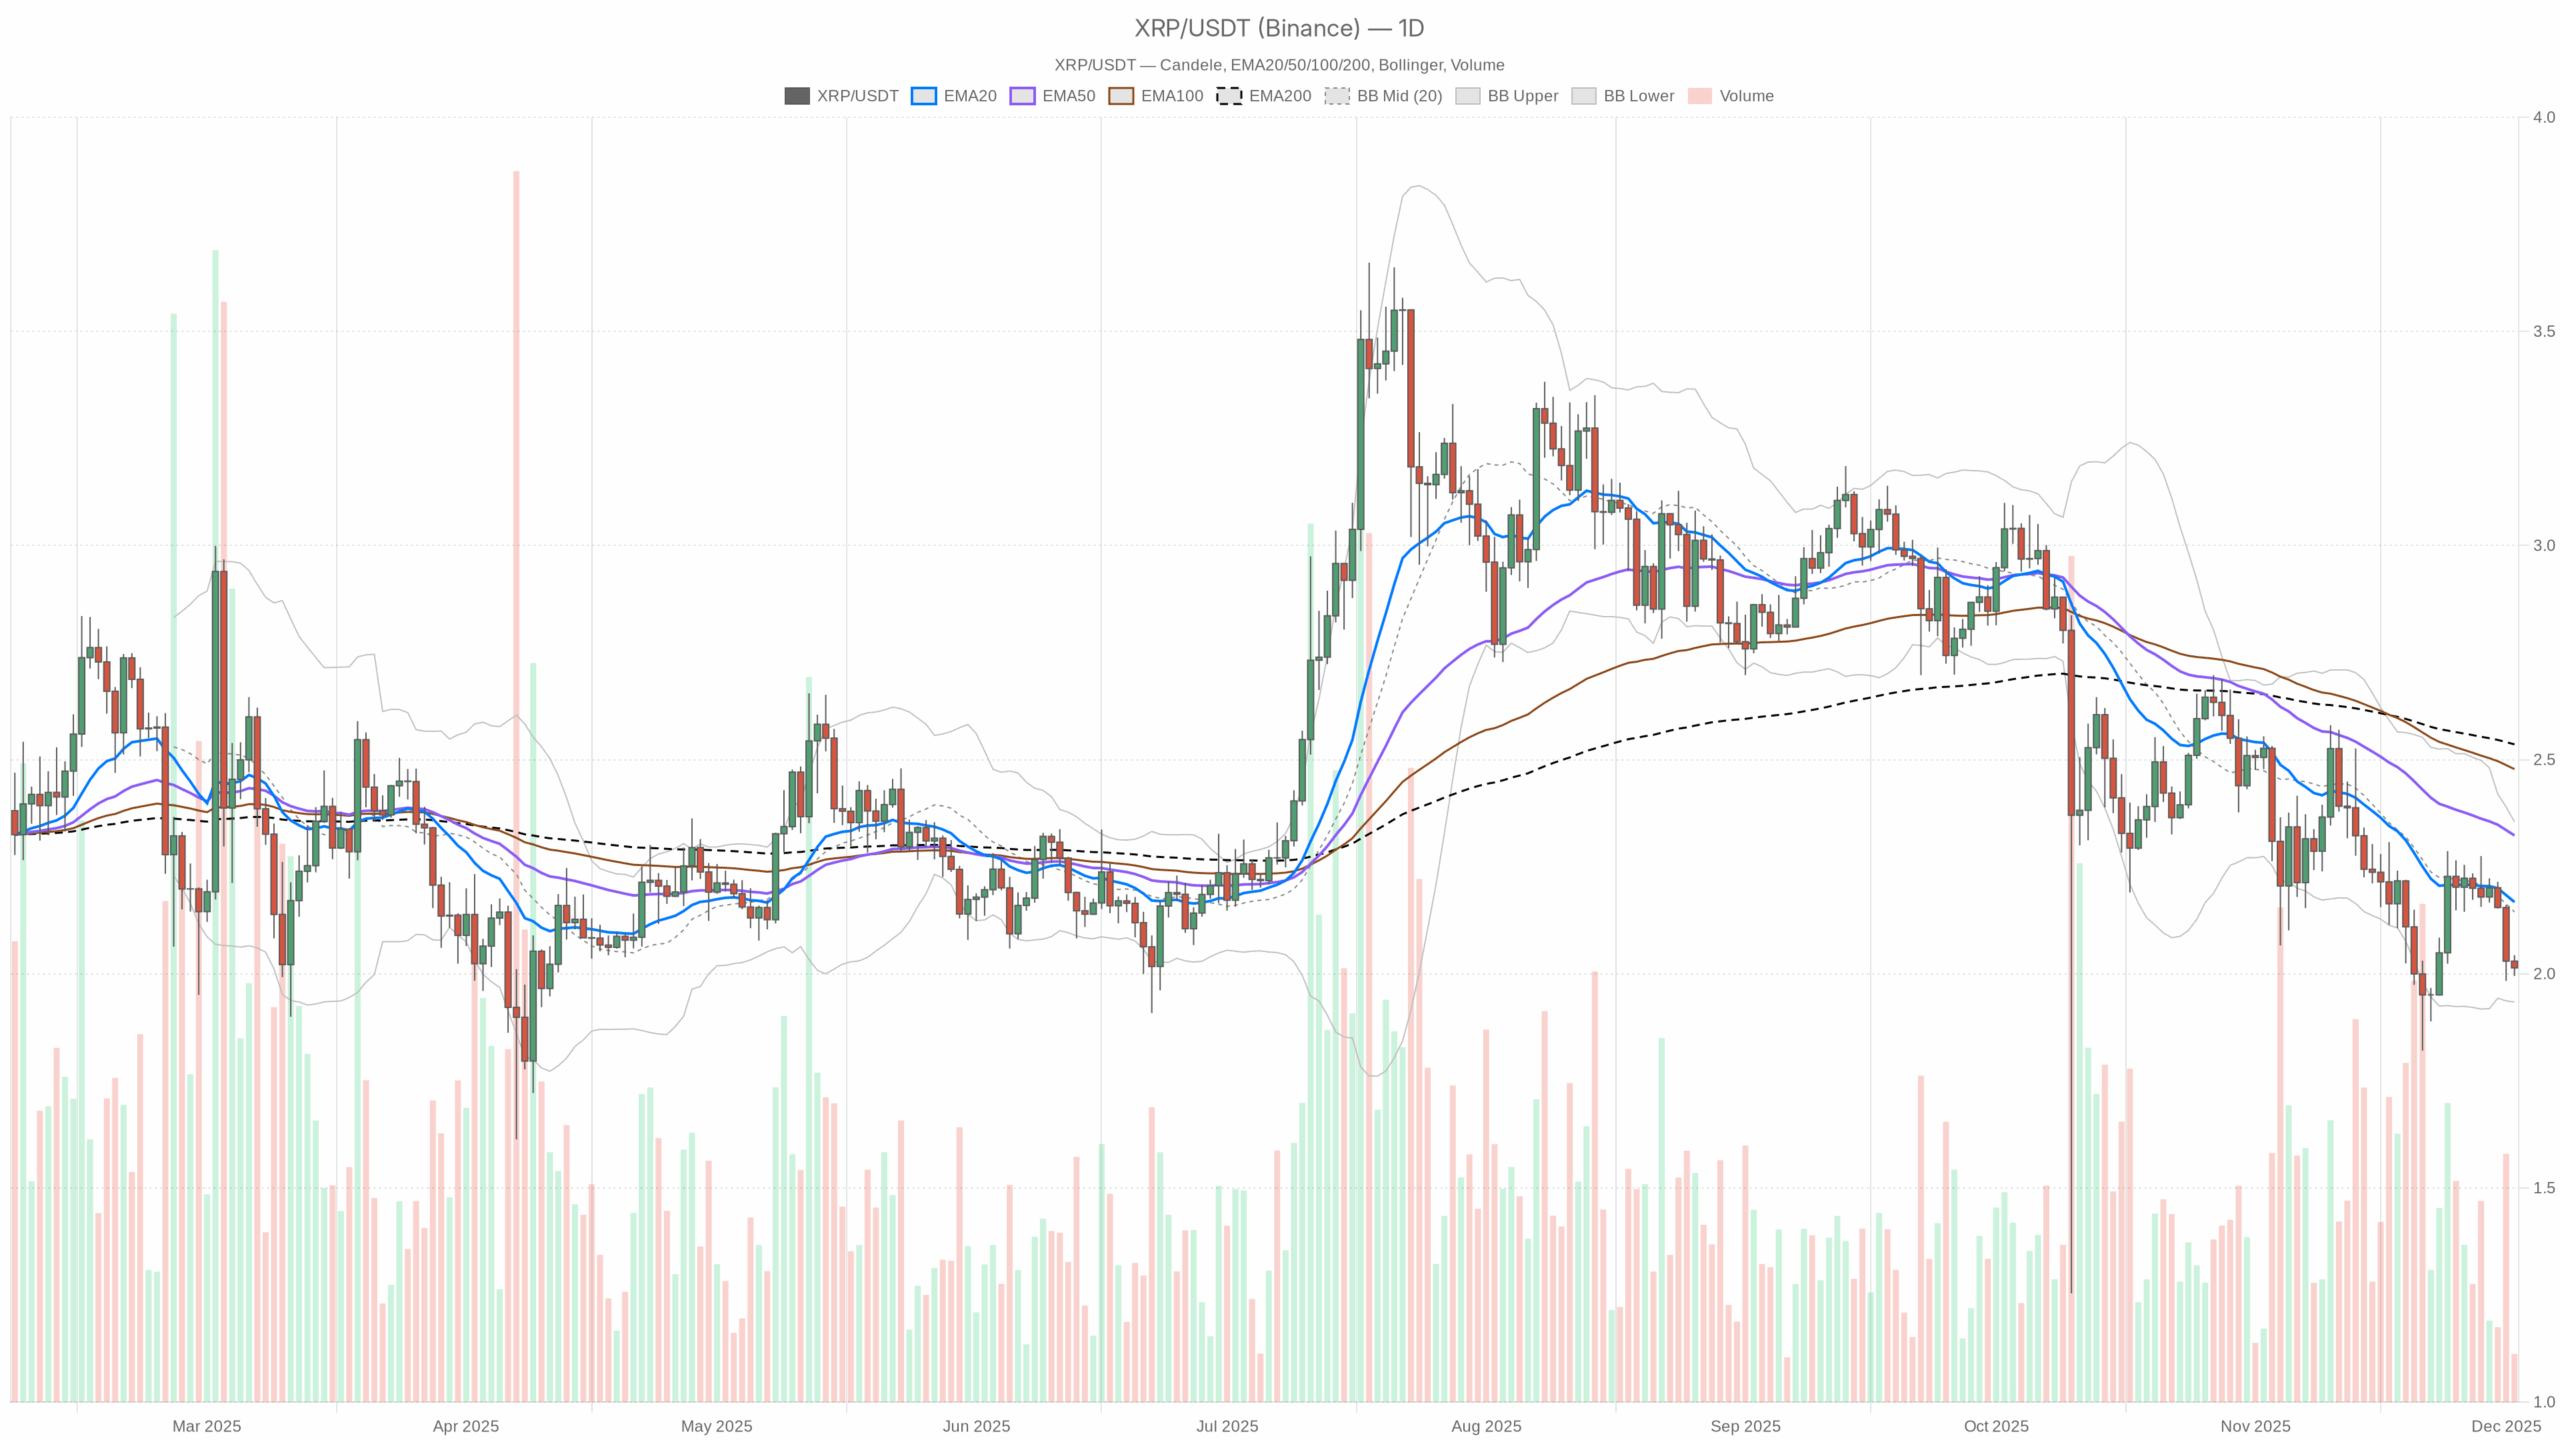 XRP/USDT — daily chart with candles, EMA20/EMA50 and volumes.
Summary
On the daily chart, the asset is quoted around 2.01, below all major exponential averages, confirming a still weak dominant trend. The RSI near the 40 threshold indicates a phase of buyer fatigue, but not yet extreme oversold. Additionally, the daily MACD is flat and near the zero line, signaling a slowed bearish momentum rather than an accelerating collapse. The Bollinger Bands are relatively compact, with a contained ATR, indicating moderate volatility after more turbulent phases. Meanwhile, even on hourly timeframes, the structure remains fragile, although there is an attempt at consolidation. Overall, the context remains defensive, with investors more inclined to caution than aggressive risk-seeking.
Ripple crypto XRP today: market context and direction
Looking at the overall picture, the daily timeframe is clearly in a bearish regime. The price remains below the 20-day average (2.17), but also below the 50 and 200-day averages, at 2.32 and 2.54 respectively. This alignment with declining averages suggests a medium-term downward pressure phase, where every rebound quickly encounters selling. Additionally, the 14-period RSI around 38 indicates that seller momentum still dominates the picture, albeit without extreme capitulation signals.
The daily MACD, with line and signal substantially coincident and negative, shows how the bearish momentum is present but not very directional. No significant divergence is observed, so the market seems more in a phase of slow bearish compression than in a violent trend. That said, as long as the price remains below the main averages, any recovery attempt will remain vulnerable to new selling.
In the macro context, Bitcoin’s dominance over 57% still signals a marked market preference for the leader over altcoins. Additionally, the Fear & Greed index positioned in “Extreme Fear” with a value of 23 highlights an extremely defensive sentiment, where many investors avoid excessive risk exposure on alts.
Overall technical picture
The three exponential averages on the daily, all above the current price, build a sort of dynamic ceiling. This configuration is typical of a consolidated bearish trend, where rebounds are often contained by the averages themselves. To truly change the scenario, the token should consistently return at least above the 20-day average area.
The RSI, below 40 but not oversold, indicates a market still controlled by sellers, but without panic. Additionally, the near overlap between MACD line and signal, with a flat histogram, suggests a loss of directional momentum: declines do not accelerate, but neither does a real recovery force appear. It is a context that often precedes either a more structured lateral consolidation or the preparation of a more decisive movement.
The Bollinger Bands have the median line in the 2.14 area, with the upper band around 2.36 and the lower near 1.93. The price is positioned in the lower part of the channel, indicating a prevalence of pressure towards the lower limit. The daily ATR around 0.13 confirms contained volatility relative to price levels: daily movements are significant but not extreme, consistent with a gradual decline rather than violent shocks.
Intraday dynamics and XRPUSDT behavior
Descending to the hourly horizon, the picture remains consistent with the weakness seen on the daily. On the H1 chart, the price at 2.01 remains below the 50 and 200-period averages, though approaching the 20-period in the 2.02 area. Meanwhile, the hourly RSI just above 40 shows an attempt at intraday stabilization, but not yet a true buying force.
The hourly MACD remains negative and almost flat, indicating trades without great directionality, in a sort of pause within a still bearish structure. Consequently, short-term movements seem more like technical rebounds than real reversals. On the 15-minute timeframe, the regime becomes neutral: the price practically coincides with the 20-period average, the RSI is near 50, and the MACD is flat. This combination highlights a micro-range intraday, where the market seems to be waiting for new impulses before choosing a clearer direction.
Key levels and market reactions
Observing the daily levels, the 2.02 area, close to the main pivot, represents a delicate equilibrium zone. Buyers try to defend the vicinity of 2.00, where the first daily support also passes, while any approach towards 2.04 tends to attract profit-taking and short-term selling. A decisive close above the 2.04–2.14 range, where pivots and the 20-day average are located, would give a first signal of easing bearish control.
Conversely, a weakening below the 1.99–2.00 area would reopen space for declines towards the lower edge of the Bollinger Bands, around 1.93. Additionally, in the short-term hourly and 15-minute, the areas around 2.01–2.02 act as a small intraday watershed: above that area, a technical rebound might prevail, below it, a new distribution phase by sellers would likely return.
General scenario and liquidity flows
The overall crypto market is worth over 3 trillion dollars, but the slight decline in capitalization over the last 24 hours suggests widespread profit-taking. In fact, with Bitcoin absorbing over 57% of the total value, the space for altcoins remains limited. Additionally, the presence of the Fear & Greed index in “Extreme Fear” indicates that investors are still reluctant to increase risk exposure, especially on less defensive tokens.
In the DeFi sector, strong increases in fees on protocols like Uniswap V3, Uniswap V4, and Curve indicate a rise in on-chain activity, often linked to phases of portfolio rebalancing and capital rotations. That said, there is still no clear mass migration from the Bitcoin sector to more speculative altcoins. For the cryptocurrency in question, this translates into a context where any rebounds risk quickly clashing with a still cautious sentiment.
Outlook and future strategies
Overall, the picture remains set to bearish, but without signs of extreme panic. The combination of price below all major daily averages, weak but not collapsed RSI, flat MACD, and moderate volatility suggests a bearish consolidation phase rather than a true final sell-off. A credible improvement would first require the recovery of the 2.10–2.20 range and subsequently a stabilization above the longer averages.
In this scenario, gradual and prudent approaches remain favored: those operating in the short term can focus on the asset’s reactions around the 2.00 and 2.04 areas, while those looking at the medium term might wait for more convincing signals of a return of structural demand. In any case, the alignment between global market sentiment, high Bitcoin dominance, and still fragile technical structure invites avoiding impulsive moves and favoring careful risk management.
This analysis is for informational purposes only and does not constitute financial advice.
Readers should conduct their own research before making any investment decisions.
You May Also Like

The FDA Is Trying To Make Corporate Free Speech Situational

Bitcoin’s cycle clock points to a final high by late October, will ETFs rewrite history?


