

Bitcoin Cash Price Analysis: BCH Leads Gainers as Traders Take Profit on Zcash (ZEC)
Bitcoin Cash BCH $598.0 24h volatility: 7.7% Market cap: $11.94 B Vol. 24h: $697.19 M extended its rally to 24% in the last 24 hours, emerging as the strongest performer among the top 25 assets. The move followed Bitcoin’s intraday push toward $94,000, which improved overall risk appetite but produced selective allocation within the privacy coin sector.
Zcash ZEC $373.4 24h volatility: 9.2% Market cap: $6.13 B Vol. 24h: $1.69 B , last month’s top gainer, fell 7% even as the broader market rebounded, while BCH, Monero, Dash and Beldex attracted renewed flows. The rotation reflected traders cutting exposure to overstretched ZEC positions and reallocating toward lagging peers.
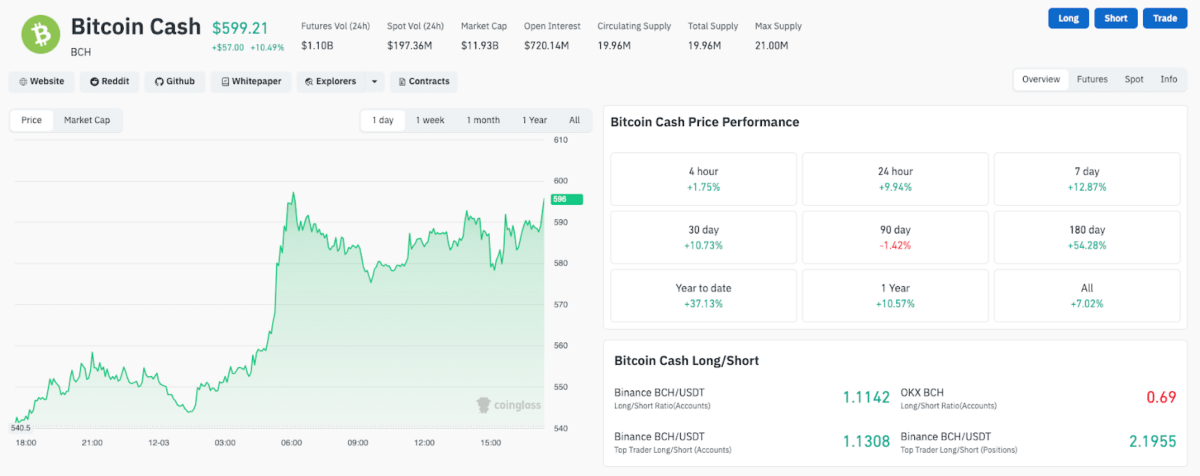
Bitcoin Cash (BCH) price performance, Dec. 3, 2025 | Source: Coinglass
Coinglass data shows BCH trading green across major timeframes, up 9.94% in 24 hours, 12.87% in seven days and 10.73% on a 30-day basis, signaling a persistent accumulation trend developing over weeks rather than a short-volatility reaction tied to Bitcoin’s December rebound.
Grayscale’s Sept. 10 filing with the SEC to convert its Bitcoin Cash Trust into a spot ETF remains a central catalyst raising expectations of institutional-grade inflows into BCH once approved.
Launched in 2018, the Grayscale Bitcoin Cash Trust trading under the ticker BCHG has already attracted $214 million in total assets under management as of Dec. 2.
Bitcoin Cash has proved popular among corporate investors in the US historically. In June 2023, EDX Markets, an institutional trading platform backed by major financial firms including Charles Schwab, Fidelity Investments, and Citadel Securities went live. At its launch, the platform offered trading for only four cryptocurrencies: Bitcoin BTC $92 711 24h volatility: 0.6% Market cap: $1.85 T Vol. 24h: $82.20 B , Ethereum ETH $3 117 24h volatility: 3.1% Market cap: $376.24 B Vol. 24h: $26.77 B , Litecoin LTC $85.95 24h volatility: 3.4% Market cap: $6.59 B Vol. 24h: $636.08 M , and Bitcoin Cash (BCH).
The addition of BCH to this select list suggested institutional confidence in BCH as a commodity at a time when altcoins like XRP and Cardano faced now-dropped charges from the SEC, labeling multiple cryptocurrencies as securities.
Bitcoin Cash Price Forecast: Will BCH Break Above $650?
Bitcoin Cash trades at $595 after a 9% intraday rally. Technical indicators show BCH now trades well above both the SMA-50 at 516.7 and the SMA-100 at 515.3, providing layered support bases for another leg higher.
The narrow gap between the SMA-50 and SMA-100 suggests sustained closes above $600 could force a golden crossover in the coming sessions.
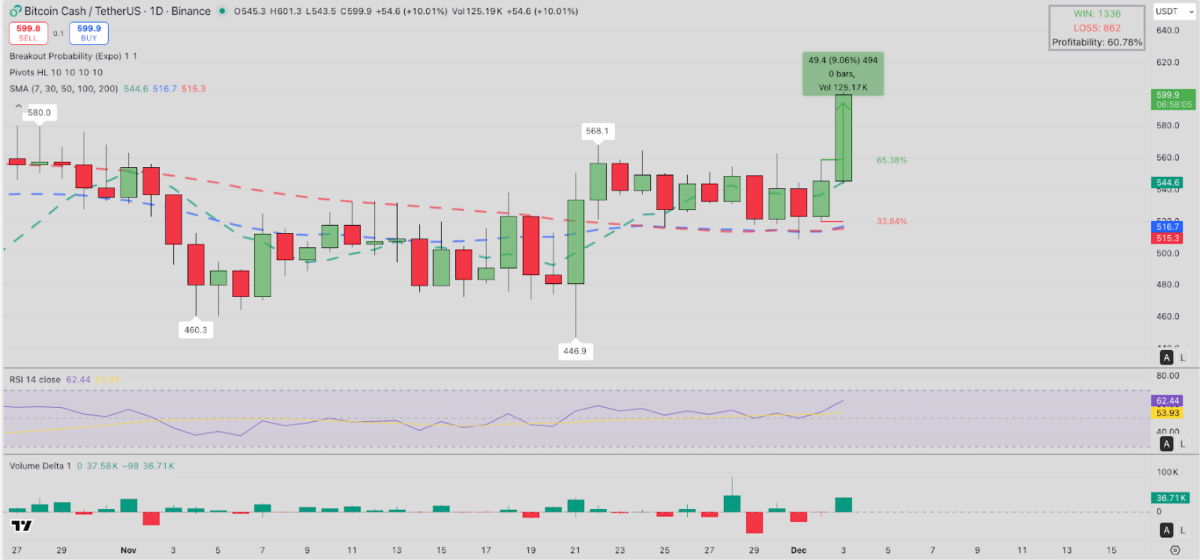
Bitcoin Cash (BCH) Price Analysis | TradingView
RSI prints at 62.25, entering a constructive expansion zone without signaling exhaustion. The slope is rising in parallel with price, which supports the argument that momentum is being built from organic demand rather than a liquidation-driven spike. As long as RSI holds above 55, BCH is likely to retain its upward trend.
Volume Delta indicator has also flipped positive with the latest 38.26K reading confirming that participation levels match the magnitude of the price move.
With a 60.78% profitability ratio, short-term traders have a significant buffer to withstand minor corrections at weaker resistance levels as BCH price approaches the $650 zone without panic selling.
On the downside, a rejection below the initial support near the SMA-7 at $545 could trigger a deeper retracement toward the SMA-50 at 516.7, invalidating the bullish forecast.
BCH Rally Accelerates: PEPENODE Presale Hits $2M Mark
While Bitcoin Cash extends its impressive rally, PEPENODE, an innovative crypto project, is entering the market spotlight with a brand new approach to digital asset mining.
PEPENODE allows users to build their own virtual meme coin mining rigs and gives them a digital space where mining plays out more like a personal project. Users can shape their own setup, adjust it, and watch it grow at their own pace.

PEPENODE Presale
While blending personal progression with token utility, PEPENODE has raised a whopping $2.25 million in its ongoing presale, with 30 hours until the next price increase. With staking rewards at 576%, early backers stand to gain the most.
Want to buy PEPENODE in the ongoing crypto presale? Learn more about the project alongside the token’s price prediction on Coinspeaker.
nextThe post Bitcoin Cash Price Analysis: BCH Leads Gainers as Traders Take Profit on Zcash (ZEC) appeared first on Coinspeaker.


You May Also Like

Ultimate Guide: Top No Deposit Bonus Casinos to Win Big


