Pump.fun (PUMP) Price Prediction 2026, 2027-2030
- Bullish PUMP price prediction for 2026 is $0.003442 to $0.005524.
- Pump.fun (PUMP) price might reach $0.1 soon.
- Bearish PUMP price prediction for 2026 is $0.001225.
In this Pump.fun (PUMP) price prediction for 2026, 2027-2030, we will analyze the price patterns of PUMP by using accurate trader-friendly technical analysis indicators and predict the future movement of the cryptocurrency.
|
TABLE OF CONTENTS
|
|
INTRODUCTION
|
|
|
PUMP.FUN PRICE PREDICTION 2026
|
|
| PUMP PRICE PREDICTION 2027, 2028-2030 |
| CONCLUSION |
| FAQ |
Pump.fun (PUMP) Current Market Status
| Current Price | $0.002522 |
| 24 – Hour Price Change | 3.65% Up |
| 24 – Hour Trading Volume | $230.64M |
| Market Cap | $893.49M |
| Circulating Supply | 354B PUMP |
| All – Time High | $0.01214 (On July 13, 2025) |
| All – Time Low | $0.001133 (On Oct 11, 2025) |
What is Pump.fun (PUMP)?
| TICKER | PUMP |
| BLOCKCHAIN | Solana |
| CATEGORY | Meme Coin |
| LAUNCHED ON | January, 2024 |
| UTILITIES | Governance, Sharing, Incentives, Rewards, and Creation |
Pump.fun (PUMP) is the native token of Pump.fun, a Solana-based platform that allows users to create and trade meme coins instantly without coding or presales. Launched in January 2024, Pump.fun introduced a bonding-curve model where token prices increase as more people buy, making it easy for anyone to launch a coin. The platform gained popularity for its viral meme culture and rapid token generation, enabling the launch of millions of tokens. In July 2025, the team officially introduced the PUMP token to give the community a stake in the platform’s success. The token serves various utilities including governance, revenue sharing, and ecosystem incentives. Distribution includes allocations for the community, team, creators, and platform development. While widely embraced by the meme coin community for its accessibility and innovation, Pump.fun has also drawn criticism for high volatility and concerns over sustainability. Nonetheless, it represents a new frontier in decentralized, gamified token creation.
Pump.fun 24H Technicals
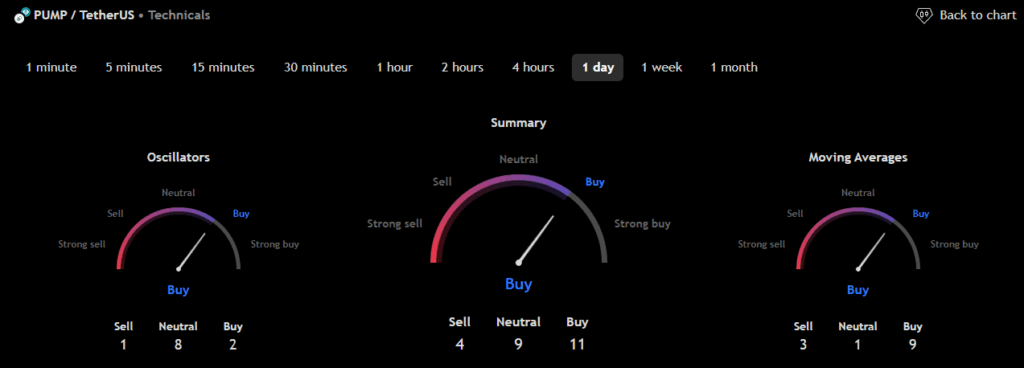 (Source: TradingView)
Pump.fun (PUMP) Price Prediction 2026
Pump.fun (PUMP) ranks 70th on CoinMarketCap in terms of its market capitalization. The overview of the Pump.fun price prediction for 2026 is explained below with a daily time frame.
In the above chart, Pump.fun (PUMP) laid out a Descending Channel pattern. A descending channel, also known as a falling channel, is a bearish technical analysis pattern formed by two parallel downward-sloping trendlines. The upper trendline connects a series of high points, indicating resistance where the price struggles to rise above, while the lower trendline connects the lower points, acting as support.
This pattern suggests that sellers are in control, with the price consistently making lower highs and lower lows. Traders often look to sell near the upper trendline and buy near the lower trendline, as the price typically oscillates within this defined range. Overall, the descending channel helps traders identify potential shorting opportunities and assess market sentiment.
At the time of analysis, the price of Pump.fun (PUMP) was recorded at $0.002522. If the trend continues, the price of PUMP might reach the resistance levels of $0.002127, $0.002363 and $0.002757. If the trend reverses, then the price of PUMP may fall to the support level of $0.002001.
Pump.fun (PUMP) Resistance and Support Levels
The chart given below elucidates the possible resistance and support levels of Pump.fun (PUMP) in 2026.
From the above chart, we can analyze and identify the following as resistance and support levels of Pump.fun (PUMP) for 2026.
| Resistance Level 1 | $0.003442 |
| Resistance Level 2 | $0.005524 |
| Support Level 1 | $0.002003 |
| Support Level 2 | $0.001225 |
Pump.fun (PUMP) Price Prediction 2026 — RVOL, MA, and RSI
The technical analysis indicators, such as Relative Volume (RVOL), Moving Average (MA), and Relative Strength Index (RSI) of Pump.fun (PUMP) are shown in the chart below.
From the readings on the chart above, we can make the following inferences regarding the current Pump.fun (PUMP) market in 2026.
| INDICATOR | PURPOSE | READING | INFERENCE |
| 50-Day Moving Average (50MA) | Nature of the current trend by comparing the average price over 50 days | 50 MA = $0.002638 Price = $0.002040 (50MA > Price) |
Bearish/Downtrend |
| Relative Strength Index (RSI) | Magnitude of price change;Analyzing oversold & overbought conditions | 17.698027 <30 = Oversold 50-70 = Neutral >70 = Overbought |
Oversold |
| Relative Volume (RVOL) | Asset’s trading volume in relation to its recent average volumes | Below cutoff line | Weak volume |
Pump.fun (PUMP) Price Prediction 2026 — ADX, RVI
In the below chart, we analyze the strength and volatility of Pump.fun (PUMP) using the following technical analysis indicators — Average Directional Index (ADX) and Relative Volatility Index (RVI).
From the readings on the chart above, we can make the following inferences regarding the price momentum of Pump.fun (PUMP).
| INDICATOR | PURPOSE | READING | INFERENCE |
| Average Directional Index (ADX) | Strength of the trend momentum | 63.133869 | Very Strong Trend |
| Relative Volatility Index (RVI) | Volatility over a specific period | 45.05 <50 = Low >50 = High |
Low volatility |
Comparison of PUMP with BTC, ETH
Let us now compare the price movements of Pump.fun (PUMP) with those of Bitcoin (BTC), and Ethereum (ETH).
From the above chart, the price action of PUMP is similar to that of BTC and ETH. That is, when the price of BTC and ETH increases or decreases, the price of PUMP also increases or decreases, respectively.
Pump.fun (PUMP) Price Prediction 2027, 2028 – 2030
With the help of the aforementioned technical analysis indicators and trend patterns, let us predict the price of Pump.fun (PUMP) between 2027, 2028, 2029, and 2030.
| Year | Bullish Price | Bearish Price |
| Pump.fun (PUMP) Price Prediction 2027 | $0.3 | $0.001 |
| Pump.fun (PUMP) Price Prediction 2028 | $0.5 | $0.0009 |
| Pump.fun (PUMP) Price Prediction 2029 | $0.7 | $0.0008 |
| Pump.fun (PUMP) Price Prediction 2030 | $0.9 | $0.0007 |
Conclusion
If Pump.fun (PUMP) establishes itself as a good investment in 2026, this year would be favorable to cryptocurrency. In conclusion, the bullish Pump.fun (PUMP) price prediction for 2026 is $0.005524. Comparatively, if unfavorable sentiment is triggered, the bearish Pump.fun (PUMP) price prediction for 2026 is $0.001225.
If the market momentum and investors’ sentiment positively elevate, then Pump.fun (PUMP) might hit $0.1. Furthermore, with future upgrades and advancements in the Pump.fun ecosystem, PUMP might surpass its current all-time high (ATH) of $0.05738 and mark its new ATH.
FAQ
1. What is Pump.fun (PUMP)?
Pump.fun (PUMP) is the native token of Pump.fun, a Solana-based platform that allows users to create and trade meme coins instantly without coding or presales.
2. Where can you purchase Pump.fun (PUMP)?
Pump.fun (PUMP) has been listed on many crypto exchanges, which include Gate.io, MEXC, Bitget, bybit, KuCoin, Kraken, LBank, BitMart, and CoinDCX.
3. Will Pump.fun (PUMP) reach a new ATH soon?
With the ongoing developments and upgrades within the Pump.fun Platform, PUMP has a high possibility of reaching its ATH soon.
4. What is the current all-time high (ATH) of Pump.fun (PUMP)?
On July 13, 2025, Pump.fun (PUMP) reached its new all-time high (ATH) of $0.01214.
5. What is the lowest price of Pump.fun (PUMP)?
According to CoinMarketCap, PUMP hit its all-time low (ATL) of $0.002282 on July 29, 2025.
6. Will Pump.fun (PUMP) reach $0.1?
If Pump.fun (PUMP) becomes one of the active cryptocurrencies that majorly maintain a bullish trend, it might rally to hit $0.1 soon.
7. What will be Pump.fun (PUMP) price by 2027?
Pump.fun (PUMP) price is expected to reach $0.3 by 2027.
8. What will be Pump.fun (PUMP) price by 2028?
Pump.fun (PUMP) price is expected to reach $0.5 by 2028.
9. What will be Pump.fun (PUMP) price by 2029?
Pump.fun (PUMP) price is expected to reach $0.7 by 2029.
10. What will be Pump.fun (PUMP) price by 2030?
Pump.fun (PUMP) price is expected to reach $0.9 by 2030.
Top Crypto Predictions
Onyxcoin (XCN) Price Prediction
Kaspa (KAS) Price Prediction
Maker (MKR) Price Prediction
Disclaimer: The opinion expressed in this article is solely the author’s. It does not represent any investment advice. TheNewsCrypto team encourages all to do their own research before investing.


You May Also Like
Micron and Sandisk Jump as Samsung Strike Threat Deepens Memory Chip Shortage

Morgan Stanley Raises 2026 S&P 500 Target to 8,000