Bitcoin Miners Add $220M to Reserves as BTC Holds $90,000 Support
Bitcoin BTC $92 118 24h volatility: 1.0% Market cap: $1.84 T Vol. 24h: $71.59 B price formed higher lows at $90,900 before settling at $91,200 at press time on Dec. 4, after failing to breach the $95,000 resistance level during the week’s early rally. On-chain data signals that aggressive accumulation among Bitcoin miners may have contributed to the firm price consolidation above $90,000.
Bitcoin held firm above the $90,000 handle on Dec. 2, limiting intraday losses to under 2%. Trading volume declined by 15%, pointing to clear seller fatigue. This reluctance to sell also reflects in Bitcoin miners activity over the past two weeks.
CryptoQuant’s miner reserve data, which monitors real-time balances across crypto wallets linked to recognized miners and mining pools, shows a significant accumulation trend.
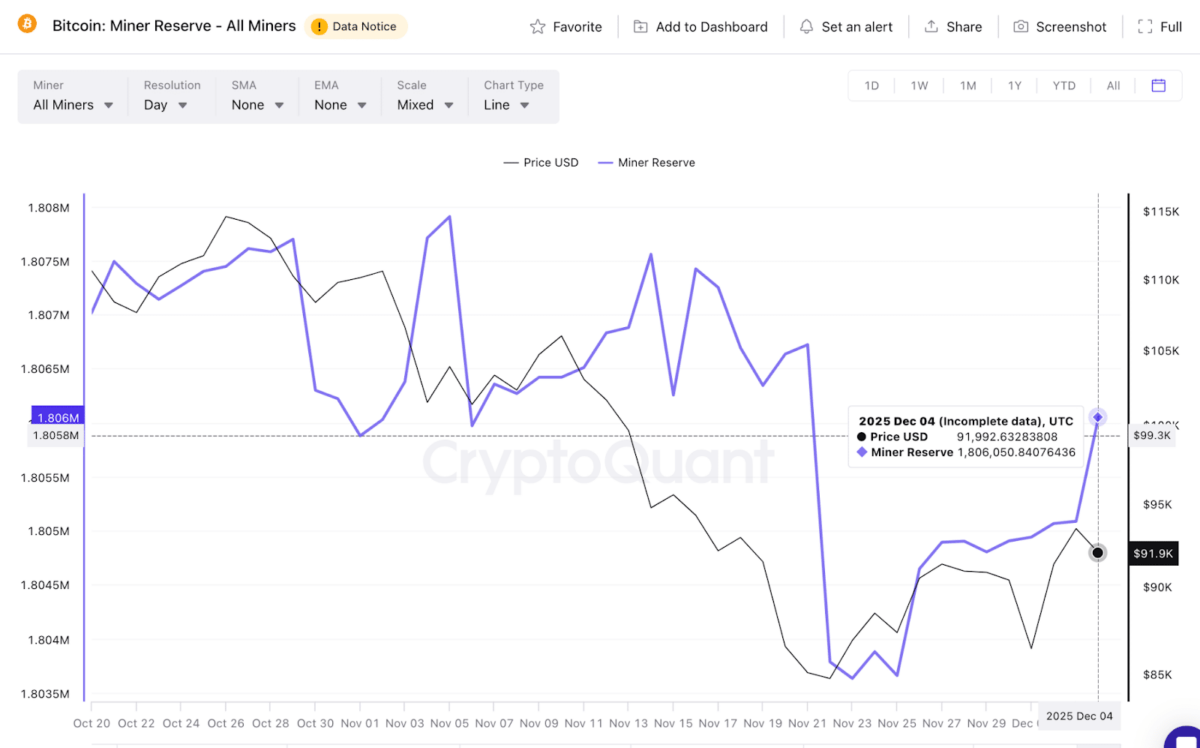
Bitcoin Miners Reserves rise 2,417 BTC between Nov 23 to Dec 4 | Source: CryptoQuant
Miners held a total of 1,803,633 BTC on Nov. 23, before Bitcoin crash. That figure climbed to 1,806,050 BTC as of Dec. 4, marking an 11-day increase of 2,417 BTC valued at approximately $220.4 million. Keeping such a large tranche of BTC off the open market reduces circulating supply, helping to ease immediate sell pressure.
Miner accumulation signals confidence in the near-term price outlook, which encourages spot buyers to defend support zones. When miners conserve newly-mined BTC supply, it tightens order books, making it harder for bears to force rapid breakdowns.
Bitcoin’s 4-hour chart shows a recovery pattern following the Nov. 26 drop to $80,600, consolidating above $90,000 as momentum indicators suggest weakening bearish pressure. BTC is currently trading around $92,120 after breaking above a key descending trendline, with bulls working to establish stronger support at current levels.
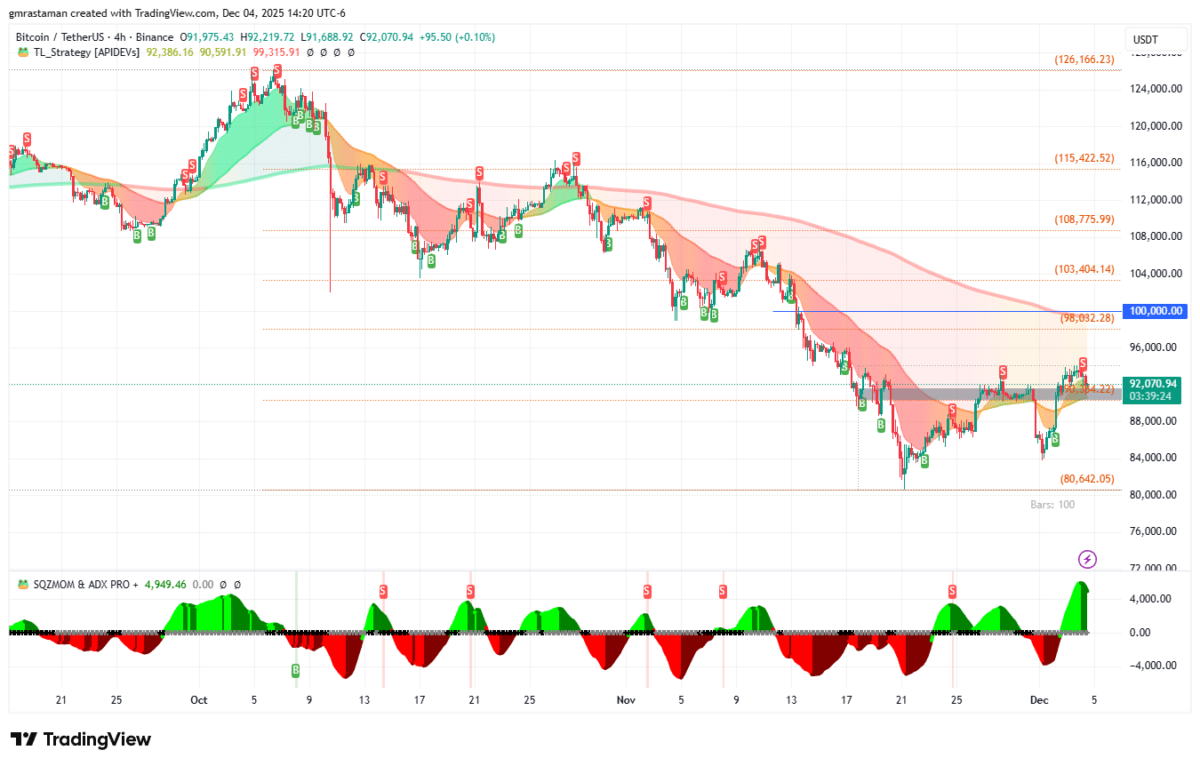
Bitcoin’s 4-hour chart | TradingView
Blockdaemon-VerifiedX Partnership Aims to Bring Retail Bitcoin Payments to the Mass Market
Institutional blockchain infrastructure provider Blockdaemon and Bitcoin sidechain VerifiedX announced a strategic product integration designed to accelerate BTC adoption in retail transactions.
According to a CoinDesk report on Dec. 4, Blockdaemon’s staking, node operations and liquidity-management systems will now power VerifiedX’s two flagship consumer applications, the Switchblade self-custody wallet and the Butterfly social-payments platform.
The collaboration aims to replicate existing successful cryptocurrency use cases including PayPal’s Venmo or Block’s Cash App.
VerifiedX users will be able to earn yield on Bitcoin and stablecoins, borrow against their holdings, and access on-chain credit markets without relying on centralized exchanges or custodians.
The partnership addresses key challenges including seed-phrase handling and manual wallet management that deter casual users. By hiding these complexities behind simple login methods and familiar payment interfaces, the integration aims to lower barriers for daily retail transactions.
nextThe post Bitcoin Miners Add $220M to Reserves as BTC Holds $90,000 Support appeared first on Coinspeaker.


You May Also Like

Is Trump Manipulating the Crypto Market?
XRP Tightens Near $1.33 as Market Builds Pressure Between Key Support and Resistance Levels