

Chainlink price prediction: Can LINK remain bullish after its ETF went live?
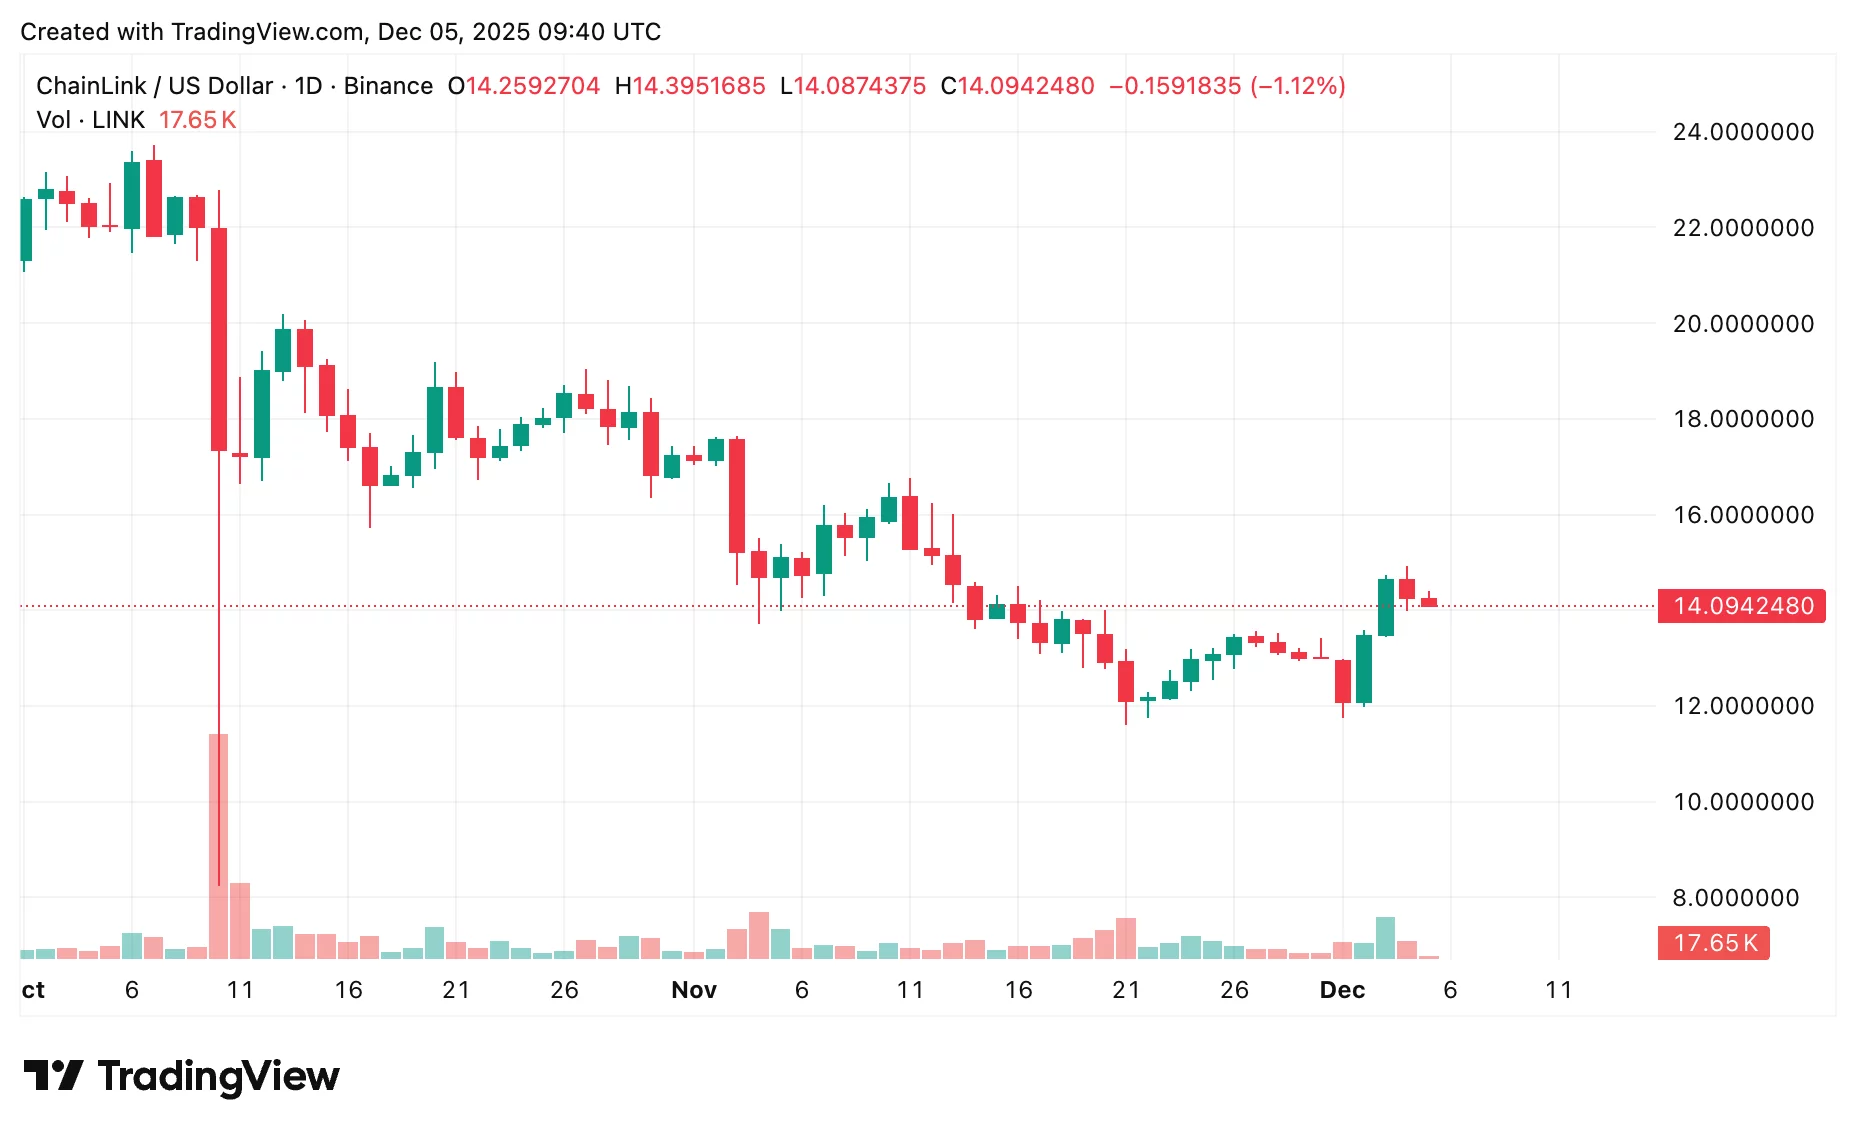
It’s been a big few days for Chainlink. The LINK price jumped to $14.84 thanks to stronger network activity, growing institutional interest, and the attention surrounding Grayscale’s new Chainlink ETF (GLNK). But the rally didn’t last long, and the price slipped back down to $11.79.
By December 5, the LINK price had started to recover, hovering around $14.1 and posting almost a 5% gain over the past week. So where does Chainlink go from here — what does the Chainlink outlook look like now?
Table of Contents
- Current market scenario
- Bullish outlook
- Bearish scenario
- Chainlink price prediction based on current conditions
- LINK price volatility: Chainlink surged to $14.84 before dropping to $11.79, then rebounded toward $14.1.
- Recovery supported by Grayscale’s new Chainlink ETF launch and a new Solana–Base bridge developed with Coinbase.
- Chainlink’s growing institutional interest and cross-chain expansion strengthen its near-term momentum.
- A breakout above $14.6 could open the door to $18.3–$19.3.
- Losing support at $11.6 may push LINK down toward the $9 zone.
Current market scenario
Chainlink (LINK) slid to about $11.79, but has already managed to rebound and head up toward $14 again.
The rebound was likely driven by Grayscale launching its Chainlink ETF on NYSE Arca, giving LINK a rare institution-focused investment product.
On top of that, Coinbase and Chainlink have officially rolled out a new bridge connecting Solana and Base, Ethereum’s Layer-2 network.
All of this strengthens the broader narrative around Chainlink, suggesting that growing institutional interest and expanding cross-chain infrastructure could continue to support LINK’s momentum in the near term.
Bullish outlook
The big level to watch is $14.6. A clean break and hold above that line — with volume to back it up — could spark a run to $18.3 and maybe even $19.3. If that happens, Chainlink could easily rank among the top large-cap movers, helped along by potential GLNK inflows.
Bearish scenario
Even with all the hype, things can change fast in the market. If LINK can’t hold its key levels, the main support to watch is $11.6 — a spot that’s acted as a solid floor in past cooldowns.
Should LINK break below $11.6, the rally could lose steam, leading to a drop toward $9 — a spot that has held up in earlier corrections.
Chainlink price prediction based on current conditions
Putting both potential outcomes into perspective, analysts generally see LINK staying within a moderate range. Most Chainlink price prediction estimates for December 2025 land between $13 and $20, shaped by adoption trends, market conditions, and the success of the ETF.
And while LINK forecasts differ slightly in their specifics, they all agree that Chainlink’s underlying strength is intact. Expanding tokenization markets, oracle demand, and cross-chain development could all support ongoing interest in LINK.
Disclosure: This article does not represent investment advice. The content and materials featured on this page are for educational purposes only.
You May Also Like
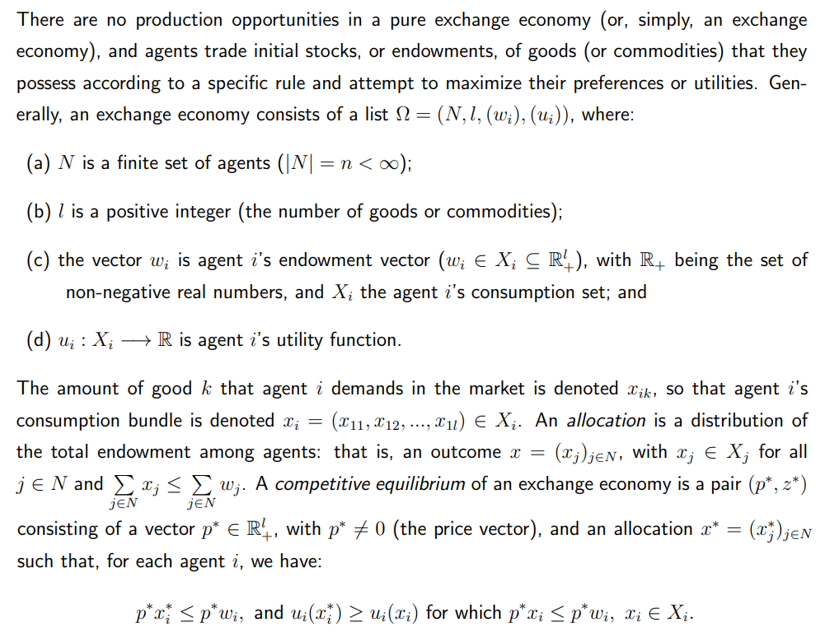
Game Theory and Exchange Economies: A New Model for Pure Exchange and Transferable Payoff

Gold Hits $3,700 as Sprott’s Wong Says Dollar’s Store-of-Value Crown May Slip


