Ethereum has retraced from the $3,240 level and is now testing the $3,150 zone as support, a key area that traders are closely watching. Bulls are attempting to defend this level after a modest rebound, but uncertainty remains high as the market tries to establish direction following weeks of volatility and aggressive selling pressure. While […]Ethereum has retraced from the $3,240 level and is now testing the $3,150 zone as support, a key area that traders are closely watching. Bulls are attempting to defend this level after a modest rebound, but uncertainty remains high as the market tries to establish direction following weeks of volatility and aggressive selling pressure. While […]

Ethereum Spot Volume Weakens As Futures Take Control Of Price Direction

2025/12/06 04:00

Ethereum has retraced from the $3,240 level and is now testing the $3,150 zone as support, a key area that traders are closely watching. Bulls are attempting to defend this level after a modest rebound, but uncertainty remains high as the market tries to establish direction following weeks of volatility and aggressive selling pressure. While some analysts view this consolidation as the early stages of a recovery, others warn that ETH may still be vulnerable to deeper pullbacks if momentum fails to strengthen.

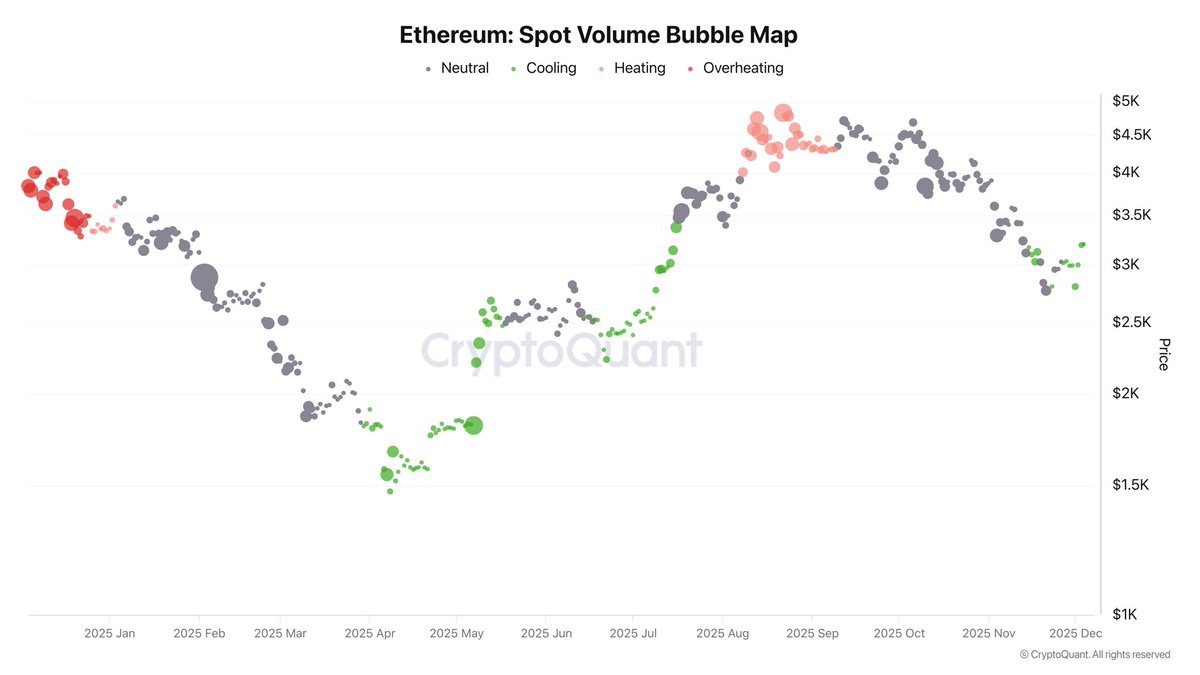
According to top analyst Darkfost, Ethereum’s recent price action is being shaped by a notable shift in market structure. Over the past few days, spot volumes have continued to decline, even as the price attempted a small recovery. This weakening in spot activity reduces the impact of actual buying and selling on the underlying asset, making futures markets increasingly influential in dictating short-term price direction.

As Darkfost explains, when spot volume thins out, futures often become the dominant driver of volatility. This dynamic can accelerate both upside and downside moves, depending on traders’ positioning. With Ethereum now sitting at a critical support level, the market awaits clearer signals to determine whether this rebound can evolve into a sustained recovery or merely represents a temporary pause in the downtrend.

Futures-Driven Momentum Raises the Stakes for Ethereum

Darkfost expands on this dynamic by noting that when spot volumes weaken to the extent seen over the past few days, the risk of heightened volatility increases sharply. Thin spot liquidity means fewer buy and sell orders are available to absorb sudden moves, allowing futures-driven momentum to exert an outsized influence on price. This environment often produces sharper swings and rapid directional shifts, as leveraged traders and algorithmic strategies dominate short-term market behavior.

Ethereum Spot Volume Bubble Map | Source: CryptoQuant

For now, the futures market is tilting upward, providing a constructive force that is helping Ethereum hold above the $3,150 support zone. Darkfost emphasizes that this upward pressure from futures could work in the bulls’ favor, as volatility—if it expands to the upside—may push the spot market to follow the same trajectory.

In other words, a sustained futures-led rebound could act as the spark needed for a broader recovery, especially if spot buyers gain confidence and begin re-entering the market.

However, this setup cuts both ways. Without stronger spot participation, any reversal in futures positioning could quickly translate into accelerated downside pressure. For now, Ethereum sits in a delicate phase where volatility is both a potential catalyst and a potential threat, making the next few sessions crucial for determining the market’s short-term direction.

ETH Weekly Structure Holds Key Support

Ethereum’s weekly chart shows a market attempting to stabilize after a steep downturn from the $4,500 region. ETH has rebounded toward $3,140, reclaiming its 100-week moving average (green line) — a historically important support level that often defines the boundary between mid-term bullish and bearish phases. This bounce signals renewed demand at a critical zone, especially after the strong wick rejection seen near $2,700, where buyers stepped in aggressively.

ETH consolidates around key level | Source: ETHUSDT chart on TradingView

However, Ethereum still faces meaningful resistance overhead. The 50-week moving average (blue line), now hovering near $3,400–$3,500, has flipped into resistance and remains the next major hurdle for bulls. A successful reclaim of this zone would materially improve ETH’s technical structure and open the door to a challenge of higher levels. Until then, the weekly trend remains neutral to slightly bearish.

Volume offers an encouraging signal: the recent rebound occurred with a noticeable uptick in buying activity compared to prior weeks, suggesting strengthened interest at these lower levels. Yet the broader structure shows a pattern of lower highs since August, meaning ETH must demonstrate follow-through to avoid slipping back into deeper consolidation.

Featured image from ChatGPT, chart from TradingView.com

Disclaimer: The articles reposted on this site are sourced from public platforms and are provided for informational purposes only. They do not necessarily reflect the views of MEXC. All rights remain with the original authors. If you believe any content infringes on third-party rights, please contact service@support.mexc.com for removal. MEXC makes no guarantees regarding the accuracy, completeness, or timeliness of the content and is not responsible for any actions taken based on the information provided. The content does not constitute financial, legal, or other professional advice, nor should it be considered a recommendation or endorsement by MEXC.

You May Also Like

XRP Price Prediction As Spot ETF Inflows Near $1 Billion: What’s Next?

XRP Price Prediction As Spot ETF Inflows Near $1 Billion: What’s Next?

The post XRP Price Prediction As Spot ETF Inflows Near $1 Billion: What’s Next? appeared on BitcoinEthereumNews.com. XRP price dropped 5% in the last 24 hours, stabilizing around $2.00 as the market faced a bearish trend. Despite strong institutional growth within Ripple, the broader crypto market decline affected XRP.  Bitcoin price hovers below $90k, pushing down prices further. Nonetheless, inflows of Spot ETFs of close to $1 billion. Analysts are optimistic that XRP may experience a positive trend in case the market revives and institutional investments keep increasing. XRP Spot ETF Sees Unstoppable Growth: Nears $1 Billion in Inflows The United States XRP spot ETF is also taking the same direction as the ETF of SOL where it records 14 consecutive days inflows and zero outflows. Such a trend indicates an increasing interest in XRP, as the ETF now approaches a large milestone of a total inflows of $1 billion. The recent statistics show high net inflows, and the price of XRP changes insignificantly, which is a sign of a high demand of the cryptocurrency, which has a positive market mood. The US 🇺🇸 spot $XRP ETF is following in $SOL‘s footsteps with 14 straight days of inflows and zero outflows so far. Currently closing in on $1 Billion inflows 👌 pic.twitter.com/tj9A7nFgv7 — Rand (@cryptorand) December 5, 2025 XRP Price Signals Potential Buy, Says Analyst A crypto analyst Ali has just provided an intriguing study of the XRP markets. According to Ali, the cryptocurrency can be going through a period of buying according to the TD Sequential indicator. The TD Sequential is a trend-following tool that is widely used to predict market trends. The chart by Ali shows a possible buy point of XRP. The graph portrays candlesticks with some being big and others being small in size. $XRP is a buy, according to the TD Sequential. pic.twitter.com/uI9s9Qwu6Y — Ali (@ali_charts) December 5, 2025 Is XRP Price…
Share
BitcoinEthereumNews2025/12/06 12:17
UChain Surges as Market Falls: Why UCN Keeps Rising

UChain Surges as Market Falls: Why UCN Keeps Rising

The post UChain Surges as Market Falls: Why UCN Keeps Rising appeared on BitcoinEthereumNews.com. It is common knowledge that assets that show strength during corrections often lead the market when it turns. UChain isn’t just holding during this correction. It’s growing. $UCN is UChain’s native L1 coin. Its rise rests on three factors: Extreme scarcity A working ecosystem of actual products Real utility both in crypto/Web3 and real-world payments. Harder Cap Than Bitcoin 100,000 UCN. That’s the total supply. Forever. Additional minting is impossible because developers renounced contract ownership, as verified on UChain’s block explorer. For context: Bitcoin has 21 million coins, which is 210 times $UCN’s supply. Most altcoins have billions or trillions in market caps, with no proof of backing. Currently, 50,000 UCN circulate. The rest is locked in staking. UChain’s hyper-deflationary model gradually reduces the $UCN supply by burning tokens through transactions. Products for Everyday Use UChain is an L1 blockchain with its own suite of products for everyday use, both in crypto and real-world payments. Throughput exceeds 2,000 transactions per second, which is 100x faster than Ethereum, on par with Solana. Blocks form every 3 seconds. The ecosystem includes: UTrading: a platform with automated trading bots operating BTC/USDT and UCN/USDT pairs on MEXC, BingX, and HTX. Bots run 24/7 using multiple strategies simultaneously. Unique licensing model: instead of time limits, there’s a return cap tied to your license tier — once hit, the bot stops. UWallet: a non-custodial wallet supporting 20+ cryptocurrencies. Only the owner controls funds, and private keys stay on the user’s device. Integrated with UDefender for cold storage. UDefender: a hardware NFC wallet for secure cold storage. Part of the mnemonic phrase lives on a physical chip card. Transactions are confirmed by tapping the card on a smartphone. UCard: a crypto debit card working in 100+ countries with limits up to €10,000 daily and €100,000 monthly. Integrated…
Share
BitcoinEthereumNews2025/12/06 12:44