Bitcoin Market Records 21% Crash In November Trading Volume – What This Means For Price
Bitcoin’s (BTC) ongoing price correction has been accompanied by several other negative developments that continue to grab investors’ attention. Most recently, market analyst Darkfost has observed a significant crash in Bitcoin spot trading volume, while highlighting potential long-term implications of such an event.
Binance Records $40B Loss In BTC Monthly Spot Trading
The spot trading volume refers to the total amount of Bitcoin that is bought and sold for immediate delivery on exchanges within a specific time period. It is a key market indicator used to gauge participation, liquidity, and investor interest. According to Darkfost in an X post on December 6, the Bitcoin market, in November, experienced a major fall in spot trading volume across major crypto exchanges. This development has been attributed to the asset’s price struggles, wherein it recorded a 17.5% devaluation during this period.
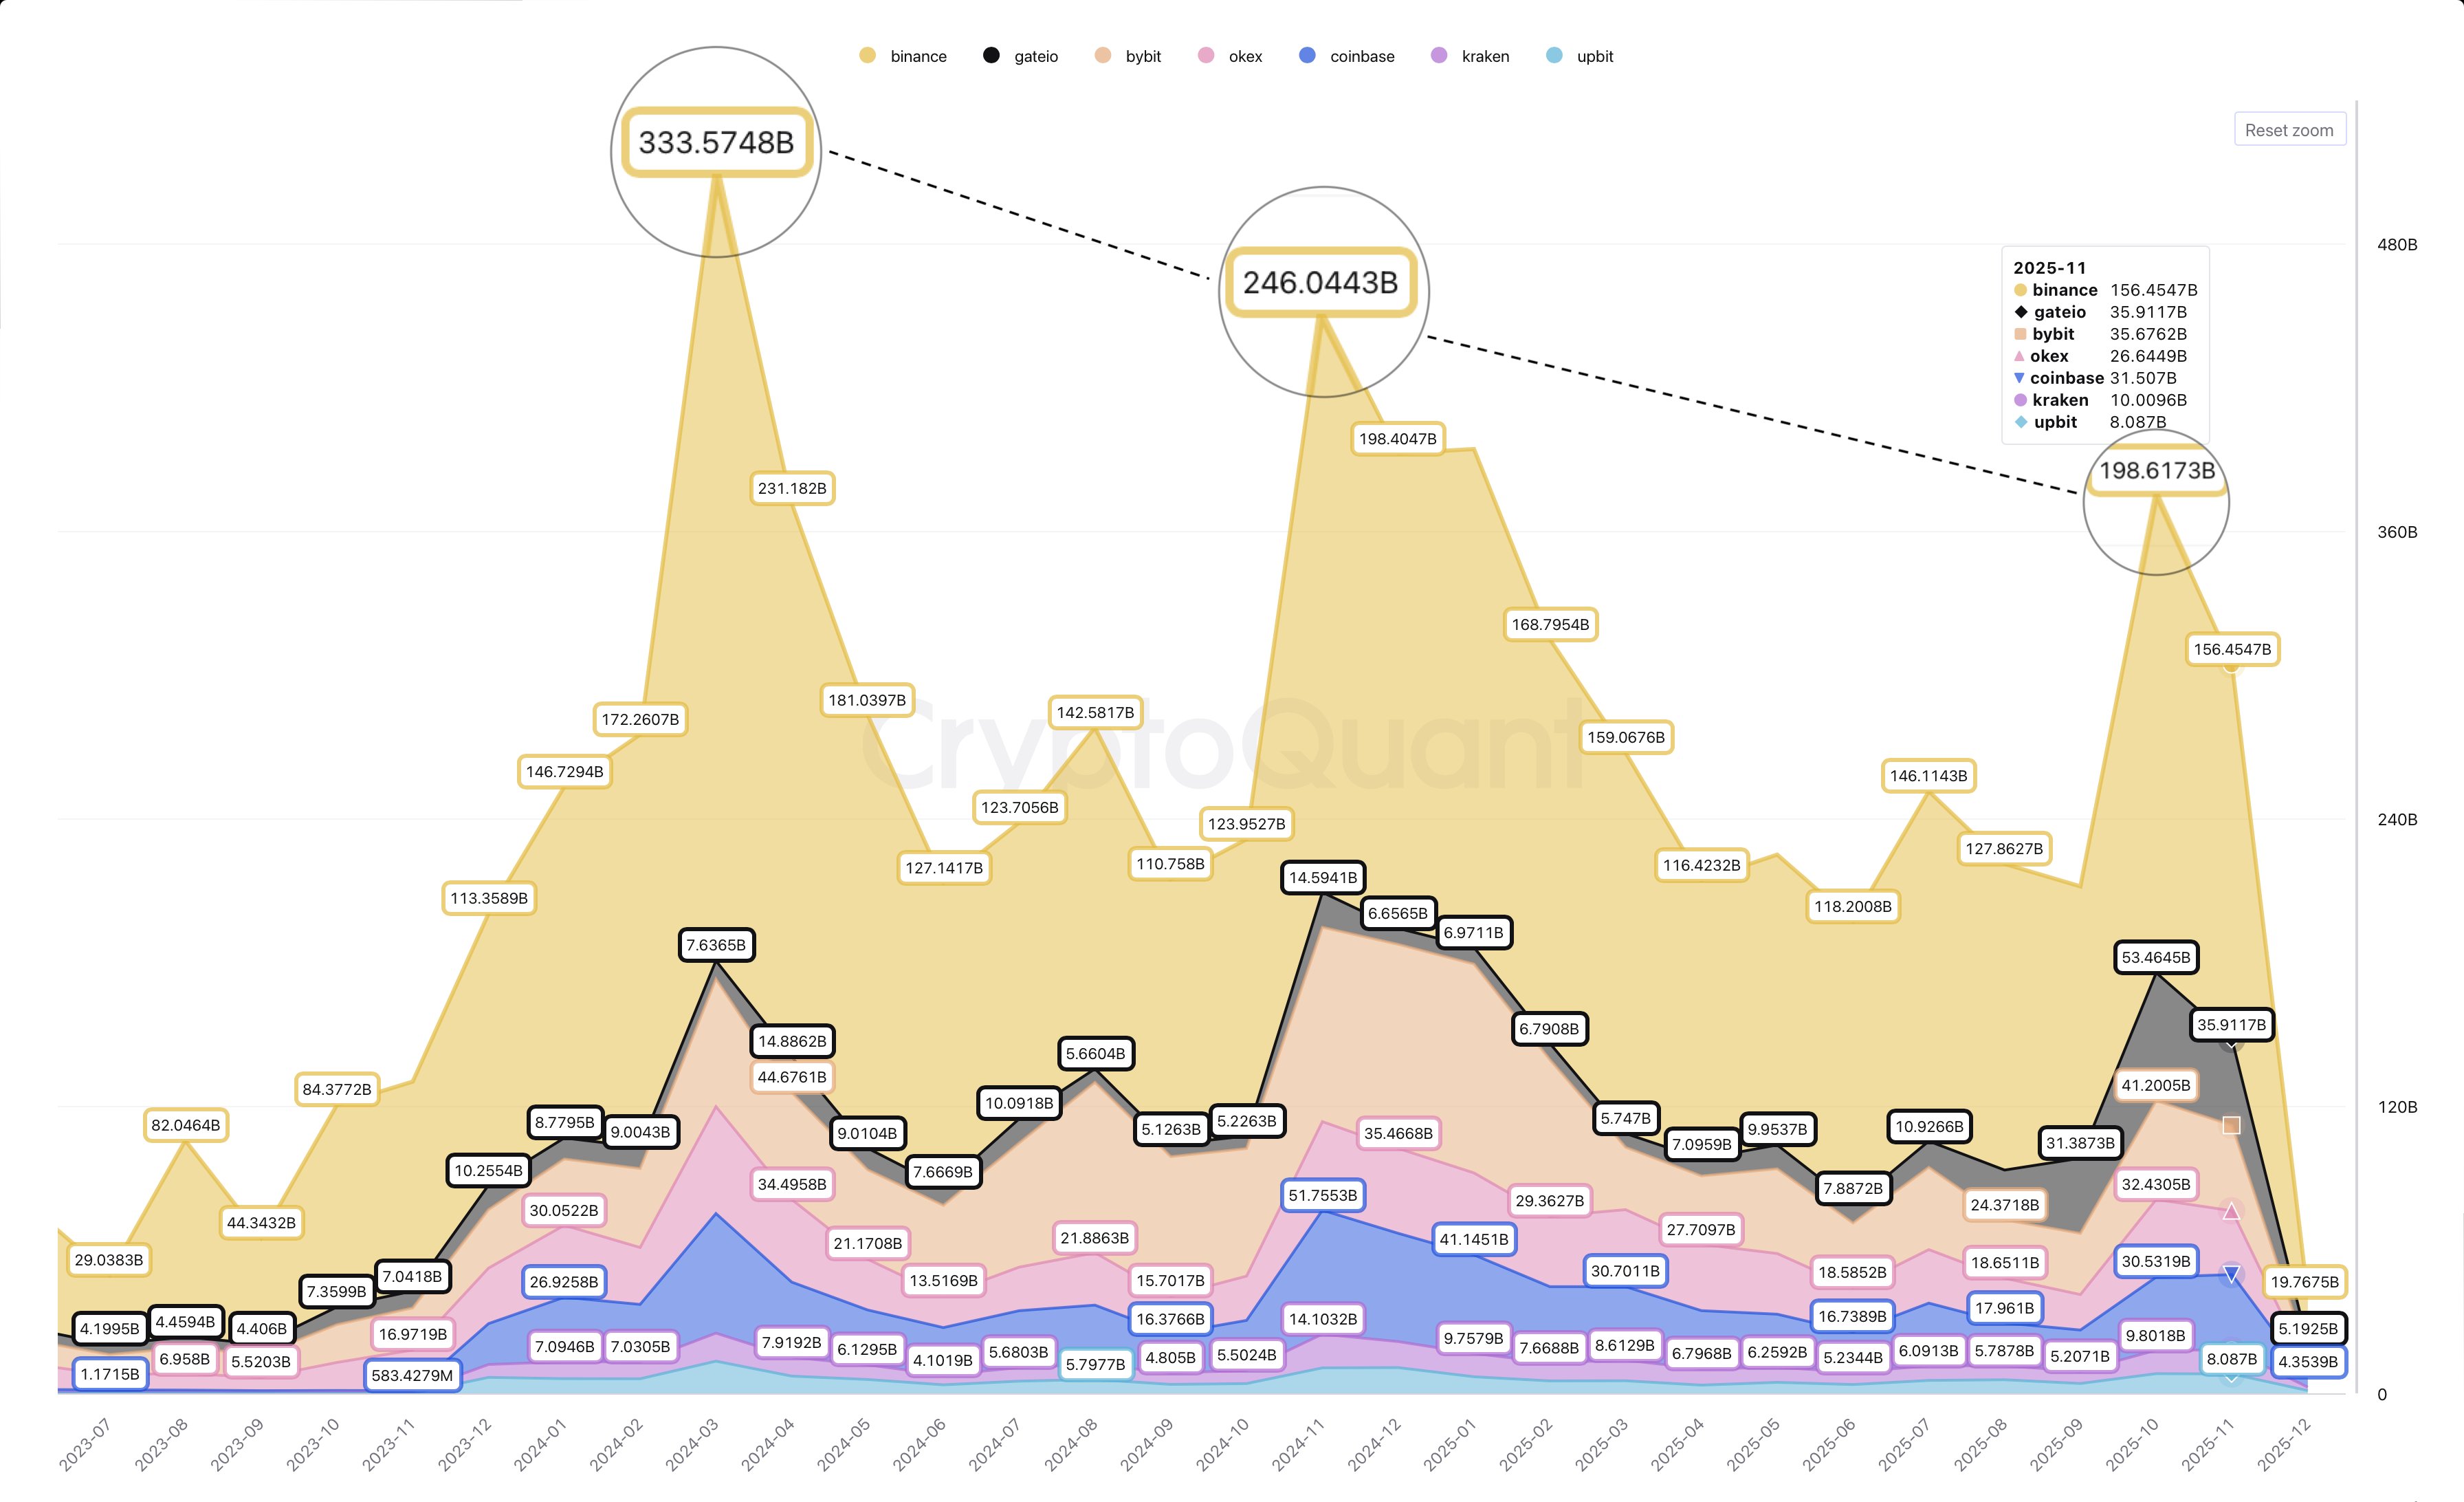
On Binance, which accounts for more than half of all Bitcoin spot trading activity, spot volume fell from $198 billion in October to $156 billion in November, representing a 21% decline. The downturn was mirrored across other major exchanges, with ByBit posting a 13.5% drop, Gate.io sliding 33%, and OKX down 18%.
Interestingly, Darkfost explains that Bitcoin’s recent price action, the major negative catalyst, pales in comparison to previous corrections. However, another red reading in December could initiate a market deterioration marked by conditions such as continued selling pressure, low market confidence, and, importantly, further drops in spot activity.
A continuous decline in spot trading volume primarily mirrors a lack of market interest and is accompanied by other concerning factors, such as a weaker demand, high vulnerability to price swings, and limited support for rallies as investors prefer to sit on the sidelines. This dynamic, in turn, weighs on price growth, creating a self-reinforcing bearish loop.
Spot Trading Volume Peak Sees Consistent Regression
In related news, Darkfost also reports that the present market cycle has featured a consistent decline in spot trading volume peaks. Notably, the chart above shows a market high of $333.57 billion on Binance in March 2024, followed by the lower peak of $246.04 billion in November 2024, and then just $198.6 billion last October.
This trend becomes even more concerning when looking at the spot-to-futures volume ratio, which currently sits at 0.23, meaning futures activity now accounts for more than 75% of overall trading. In essence, while the Bitcoin market remains active, investor enthusiasm on the spot side is fading. By contrast, traders appear increasingly willing to speculate in the futures market, likely driven by elevated uncertainty and short-term volatility.
At press time, Bitcoin trades at $89,300, reflecting a 0.21% loss in the past day.
You May Also Like

Musk reportedly plans to allocate 30% of SpaceX's new shares to retail investors, breaking with US IPO conventions.

WTI Crude Oil Plummets Below $92.00 as US Halts Iran Energy Strikes for Critical Talks